Risk Insights dashboard
The Risk Insights dashboard shows threats, suspicious activities, and security issues. Use it to detect compromised accounts, identify failed login attempts, monitor policy violations, and investigate risk events that need immediate attention. Data updates hourly.
For authentication system health and MFA adoption metrics, see Authentication Summary. For risk engine analyzer scores and credential stuffing detection, see Risk Intelligence.
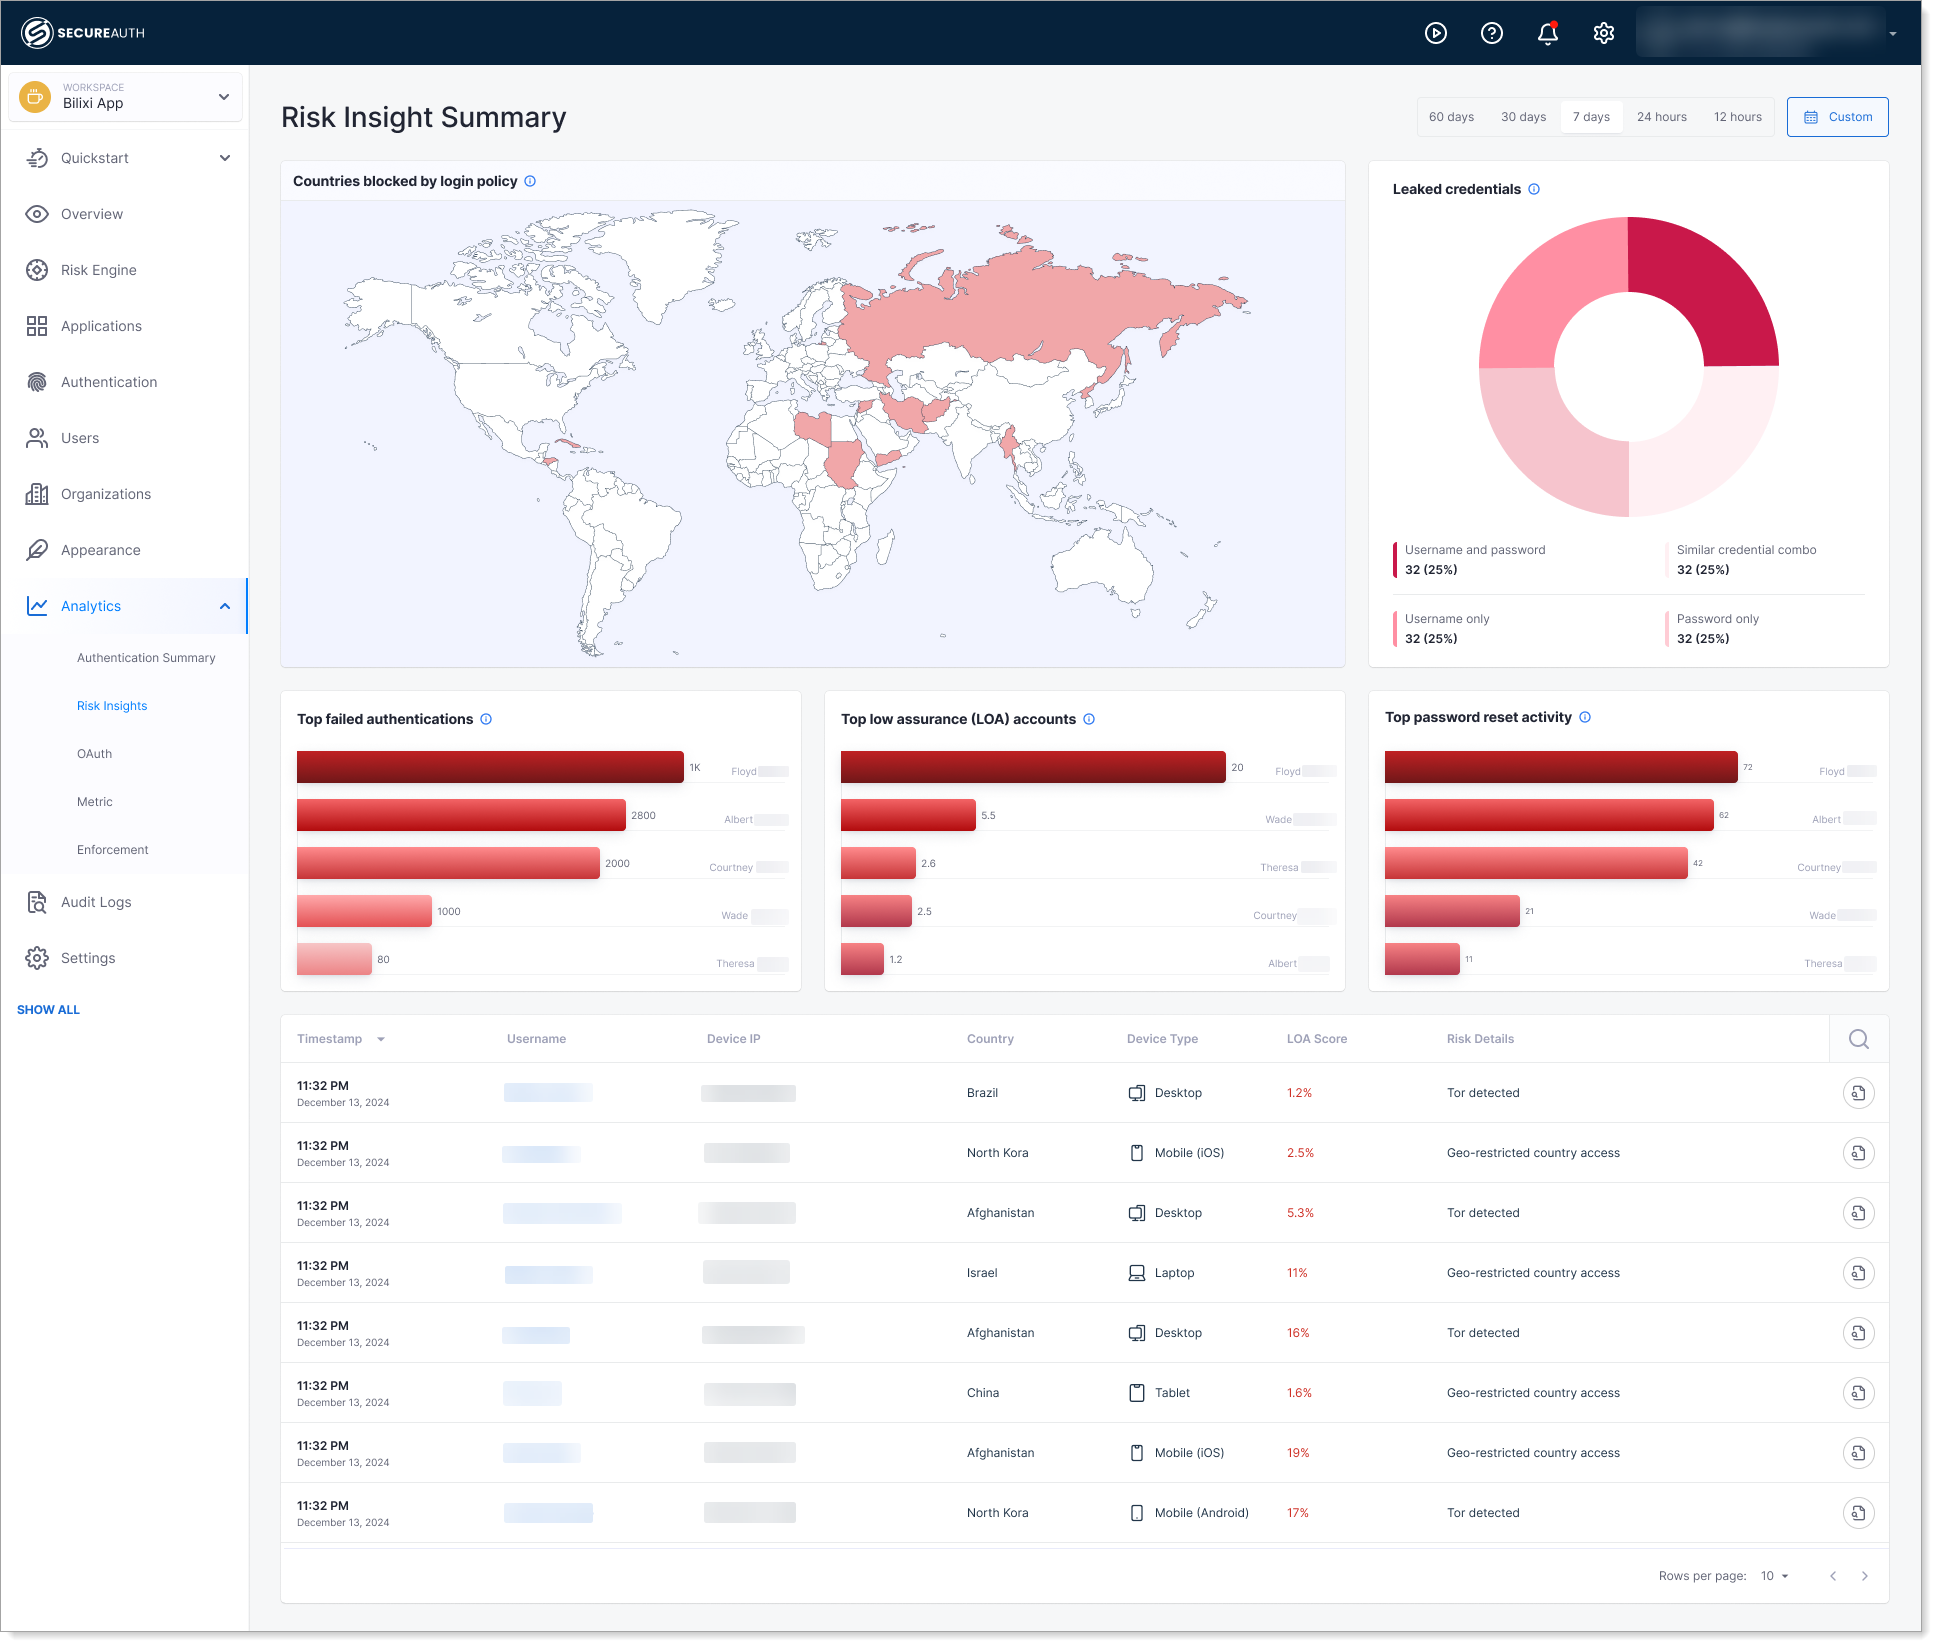
Countries Blocked by Login Policy
This map shows which countries are being blocked by your security policies.
What it shows: A world map showing which countries are blocked by your security policies. Shaded regions are blocked; unshaded regions are allowed.
Why it matters: Demonstrates that geo-blocking policies are working and alerts you to countries with high volumes of blocked login attempts.
When to check: As part of regular security audits or when investigating geographic patterns in failed authentications.
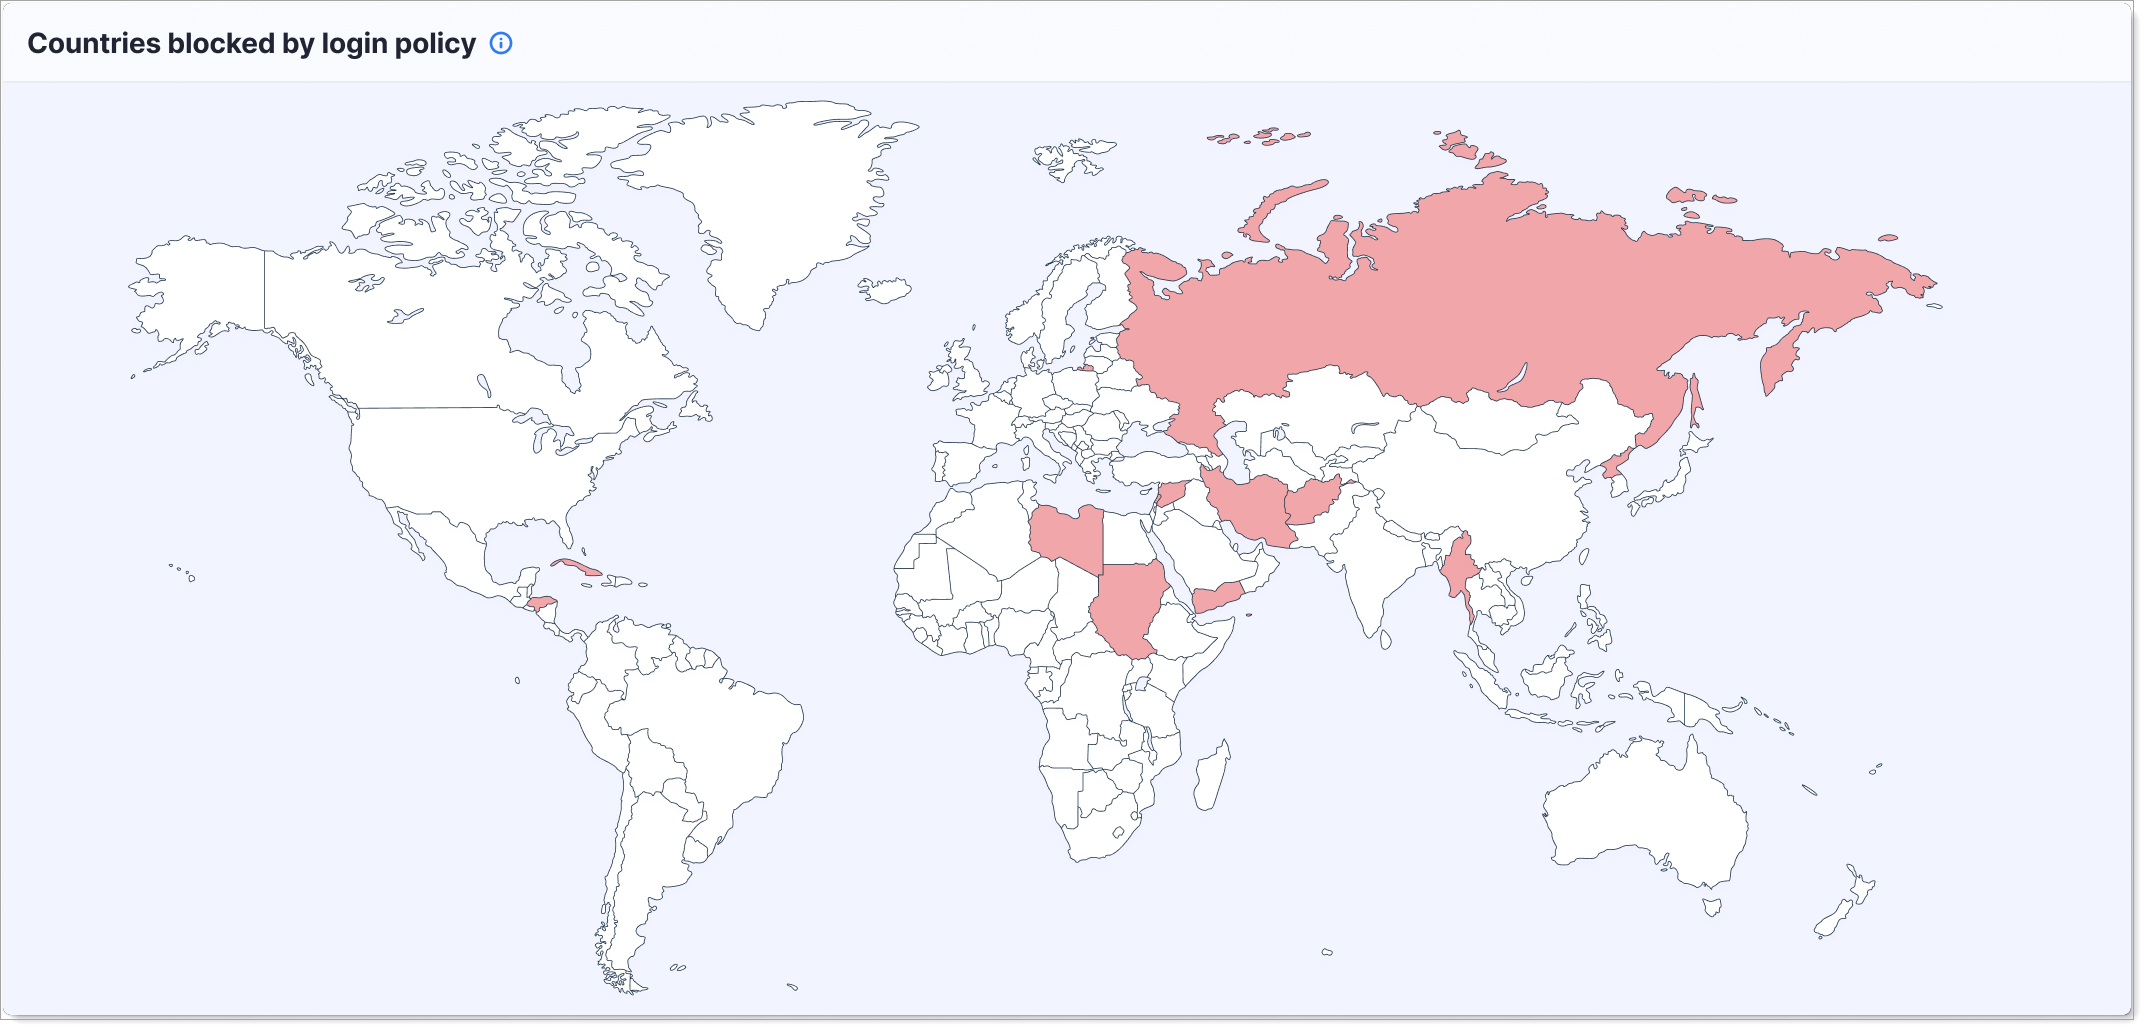
Leaked Credentials
This alert shows accounts with leaked passwords detected in public data breaches.
What it shows: Number of user accounts where passwords have been found in known data breach databases, indicating the account may be at risk of compromise. The chart breaks down compromised credentials by type: username and password, similar credential combinations, username only, or password only.
Why it matters: Leaked credentials are a primary attack vector for account takeover. Users with leaked passwords are at high risk even if their SecureAuth password is strong.
When to check: Daily or weekly to identify at-risk accounts that need immediate action like forced password resets or mandatory MFA.
What to do: Force affected users to reset their password and enable MFA on their account. Consider risk-based policies that require step-up authentication for these users.
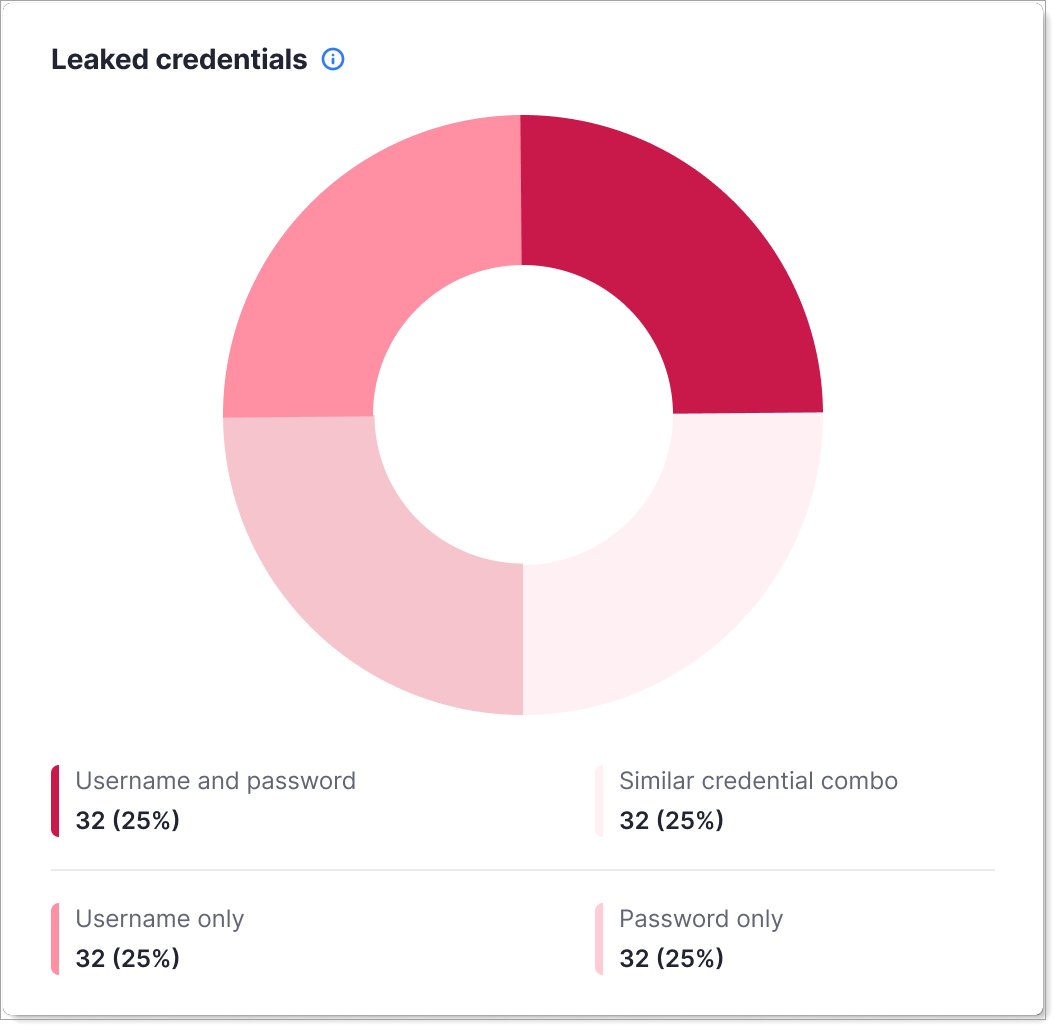
Top Failed Authentications
This chart shows which accounts have the most failed login attempts.
What it shows: List of user accounts with the highest number of failed authentication attempts during the selected time period, ranked by failure count.
Why it matters: Multiple failed login attempts can indicate account compromise (attacker guessing password), brute force attacks, or user confusion about credentials.
When to check: During investigations of suspicious activity or as part of ongoing security monitoring.
What to do: Contact affected users to confirm they're not compromised. Check if failures are due to forgotten passwords (user error) or attack attempts (security threat).
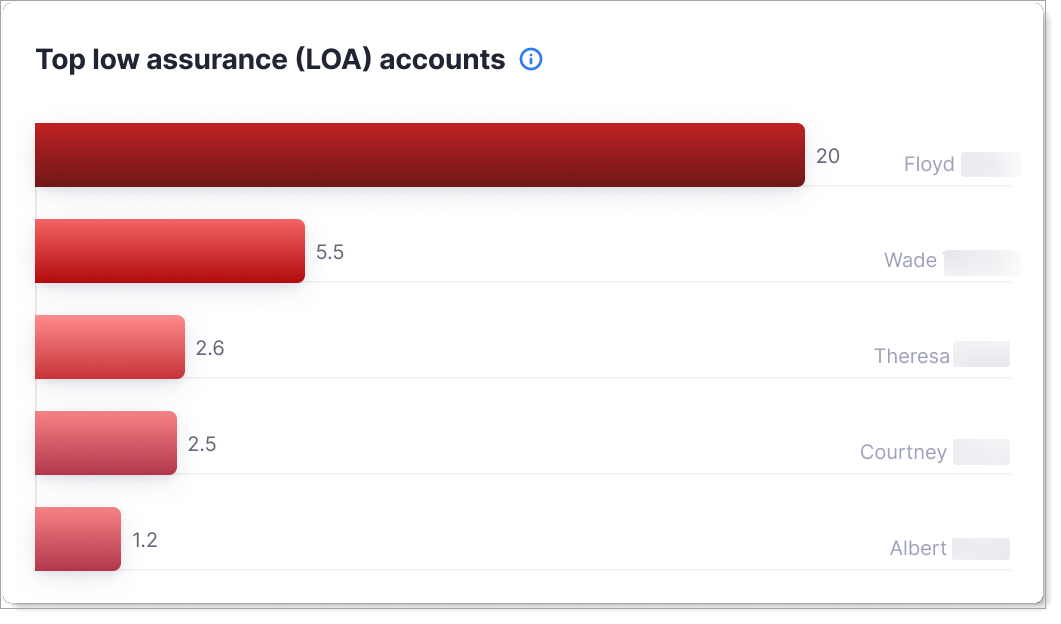
Top Low Assurance (LOA) Accounts
This chart shows accounts with consistently low Level of Assurance (LOA) scores.
What it shows: User accounts that frequently authenticate with low LOA scores, indicating weaker identity verification or higher risk factors.
Why it matters: Low LOA scores indicate the authentication didn't meet strong security standards. Users with consistently low scores may need additional authentication factors or verification.
When to check: To identify accounts that need stronger authentication requirements or policy upgrades.
What to do: Implement risk-based policies that require step-up authentication (MFA, passwordless) for low LOA authentications.
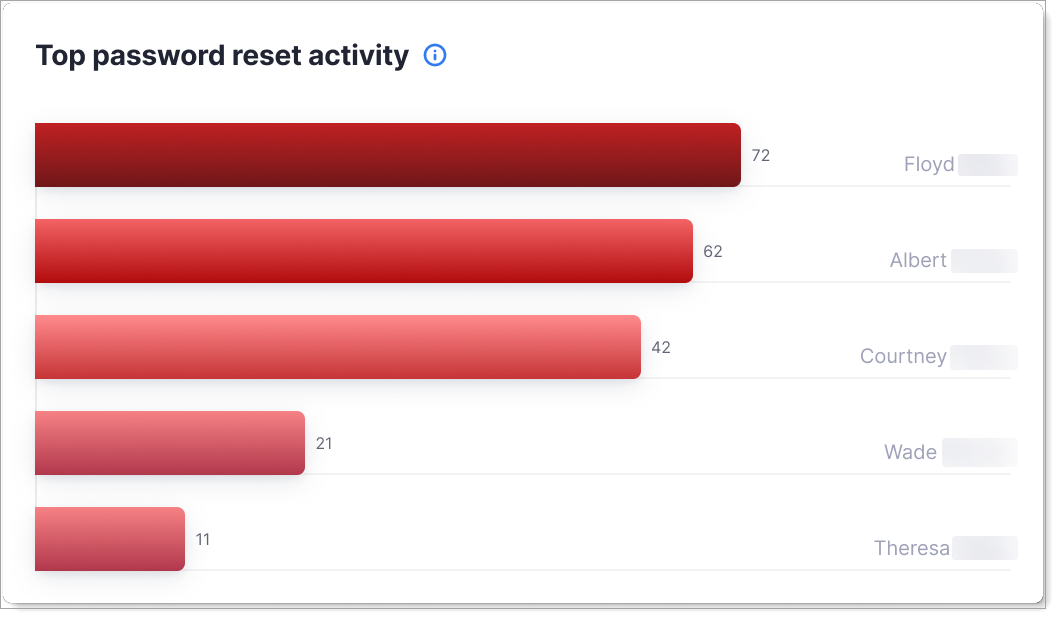
Top Password Reset Activity
This chart shows accounts requesting the most password resets.
What it shows: User accounts with the highest number of password reset requests during the selected time period.
Why it matters: Unusual password reset activity can indicate a user forgetting credentials (support burden) or an attacker trying to take over an account.
When to check: To identify users with repeated reset requests who might need help or whose accounts might be under attack.
What to do: Contact users with high reset activity. Offer support for forgotten password management or investigate if resets indicate compromise attempts.
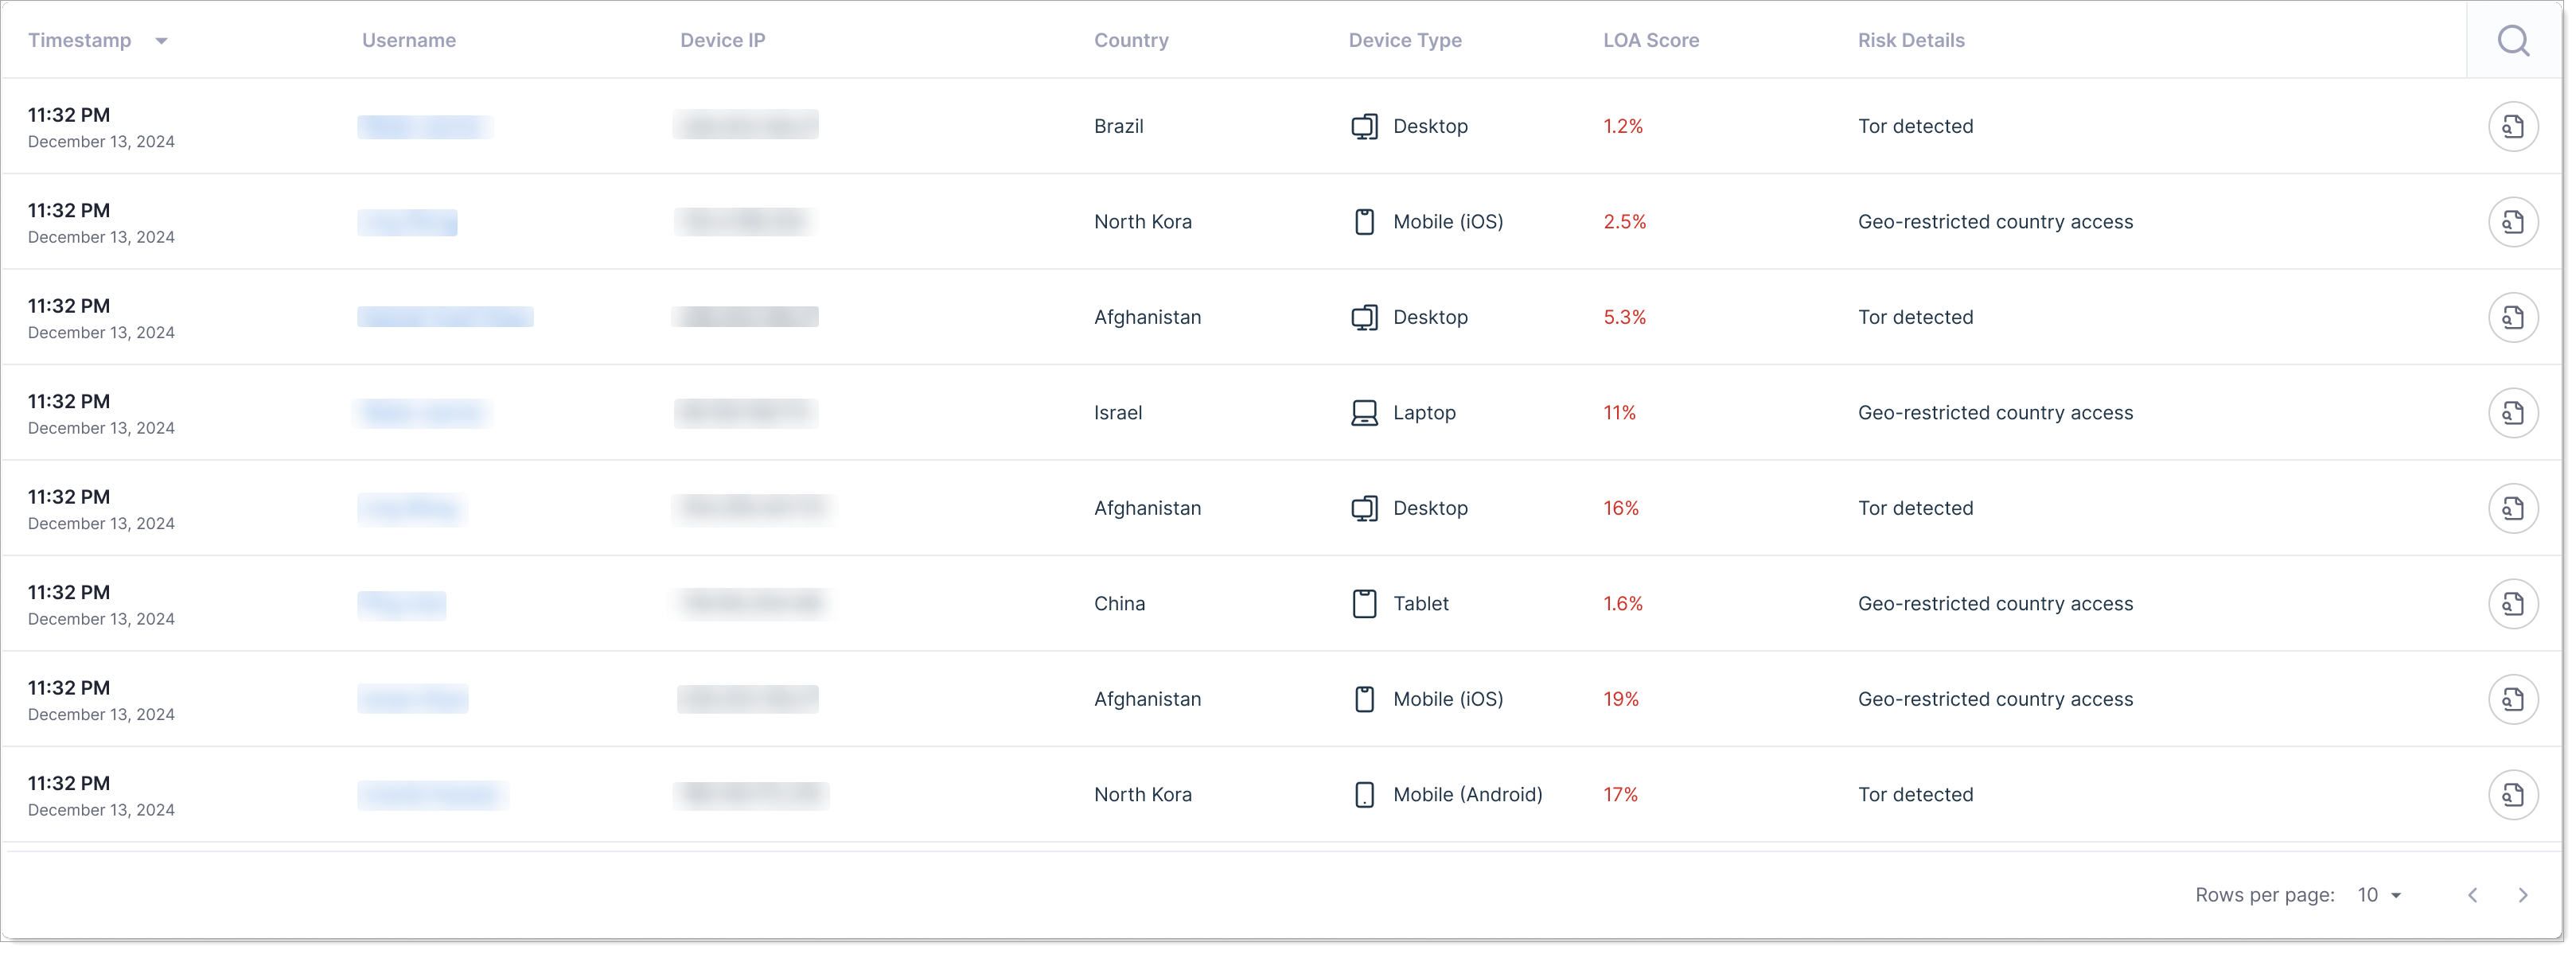
Risk Event Details
This table shows individual risk events and incidents.
What it shows: Detailed log of security events like:
- Failed authentication attempts
- Policy violations (geographic blocks, velocity checks)
- Leaked credential matches
- Unusual authentication patterns
- Step-up authentication triggers
Why it matters: Provides detailed visibility into what's happening on your system and helps you investigate specific security incidents.
Columns in the table:
| Column | Description |
|---|---|
| Timestamp | When the risk event occurred (date and time). |
| Username | The user account affected by the event. |
| Device IP | IP address where the authentication attempt originated. |
| Country | Geographic location of the login attempt. |
| Device Type | Type of device used (Desktop, Mobile, Laptop, Tablet, etc.). |
| LOA Score | Level of Assurance score as a percentage, indicating authentication confidence. |
| Risk Details | Specific information about the risk (Tor detected, Geo-restricted country access, leaked credential match, etc.). |
When to check: Investigate specific security incidents or audit suspicious activity patterns.
How to use this dashboard
- In SecureAuth Connect, from the left menu, go to Analytics > Risk Insights.
- Use the date range picker at the top to select the time period you want to analyze.
- Review each section for threats and suspicious activity.
- Click on specific events in the Risk Event Details table to investigate further.
When to escalate
Contact your security team if you see:
- Sudden spike in failed authentications
- Multiple accounts with leaked credentials
- Coordinated activity from blocked countries (possible brute force attack)
- Accounts with consistently low LOA scores
- Unusual geographic patterns or velocity