Dashboard quick reference
SecureAuth Connect provides dashboards like Authentication Summary and Risk Insights to monitor system health and detect threats. Use this quick reference to find which dashboard answers your specific question about authentication patterns, user risk scores, compromised accounts, or failed login attempts.
Find your dashboard
| What you want to see | Dashboard | Where to find it |
|---|---|---|
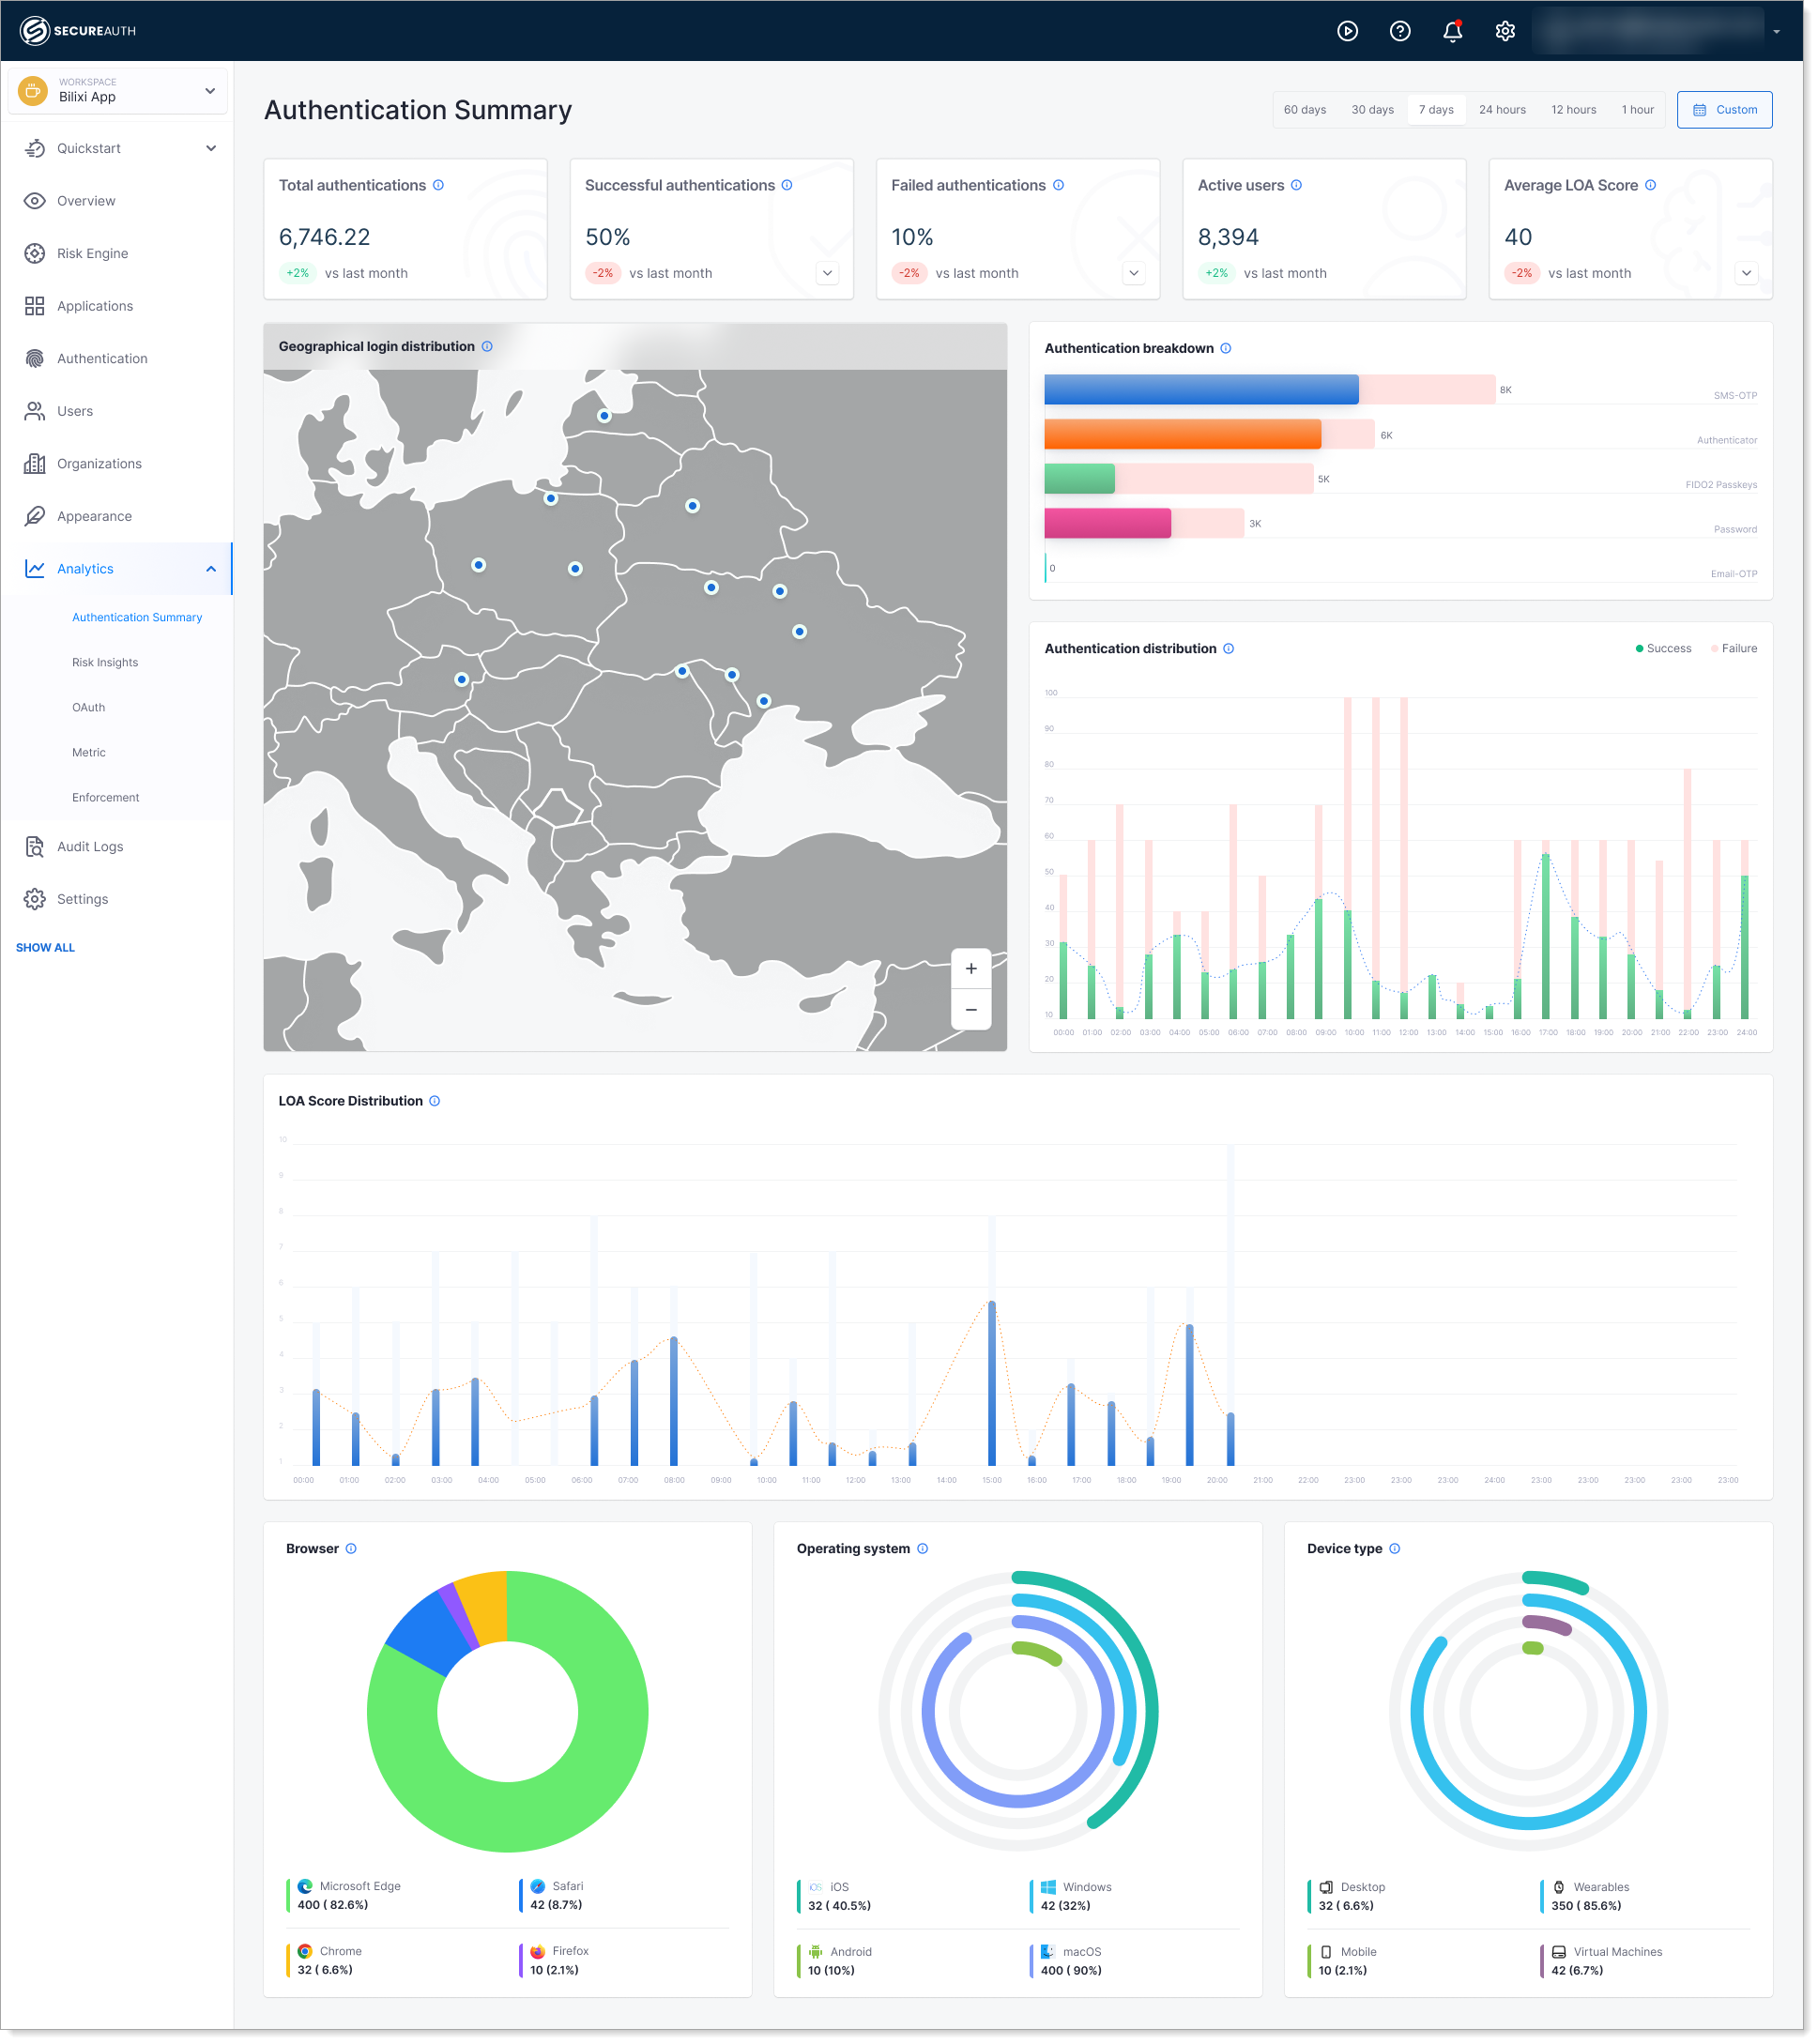
| Overall system health and authentication activity | Authentication Summary | Analytics > Authentication Summary |
| Shows where users log in from | Geographical Login Distribution | Analytics > Authentication Summary |
| How users are authenticating (password, MFA, passwordless) | Authentication Breakdown | Analytics > Authentication Summary |
| Login patterns by time of day | Authentication Distribution | Analytics > Authentication Summary |
| User risk scores and Level of Assurance (LOA) | LOA Score Distribution | Analytics > Authentication Summary |
| What devices, browsers, and operating systems are in use | Device/Browser/OS Intelligence | Analytics > Authentication Summary |
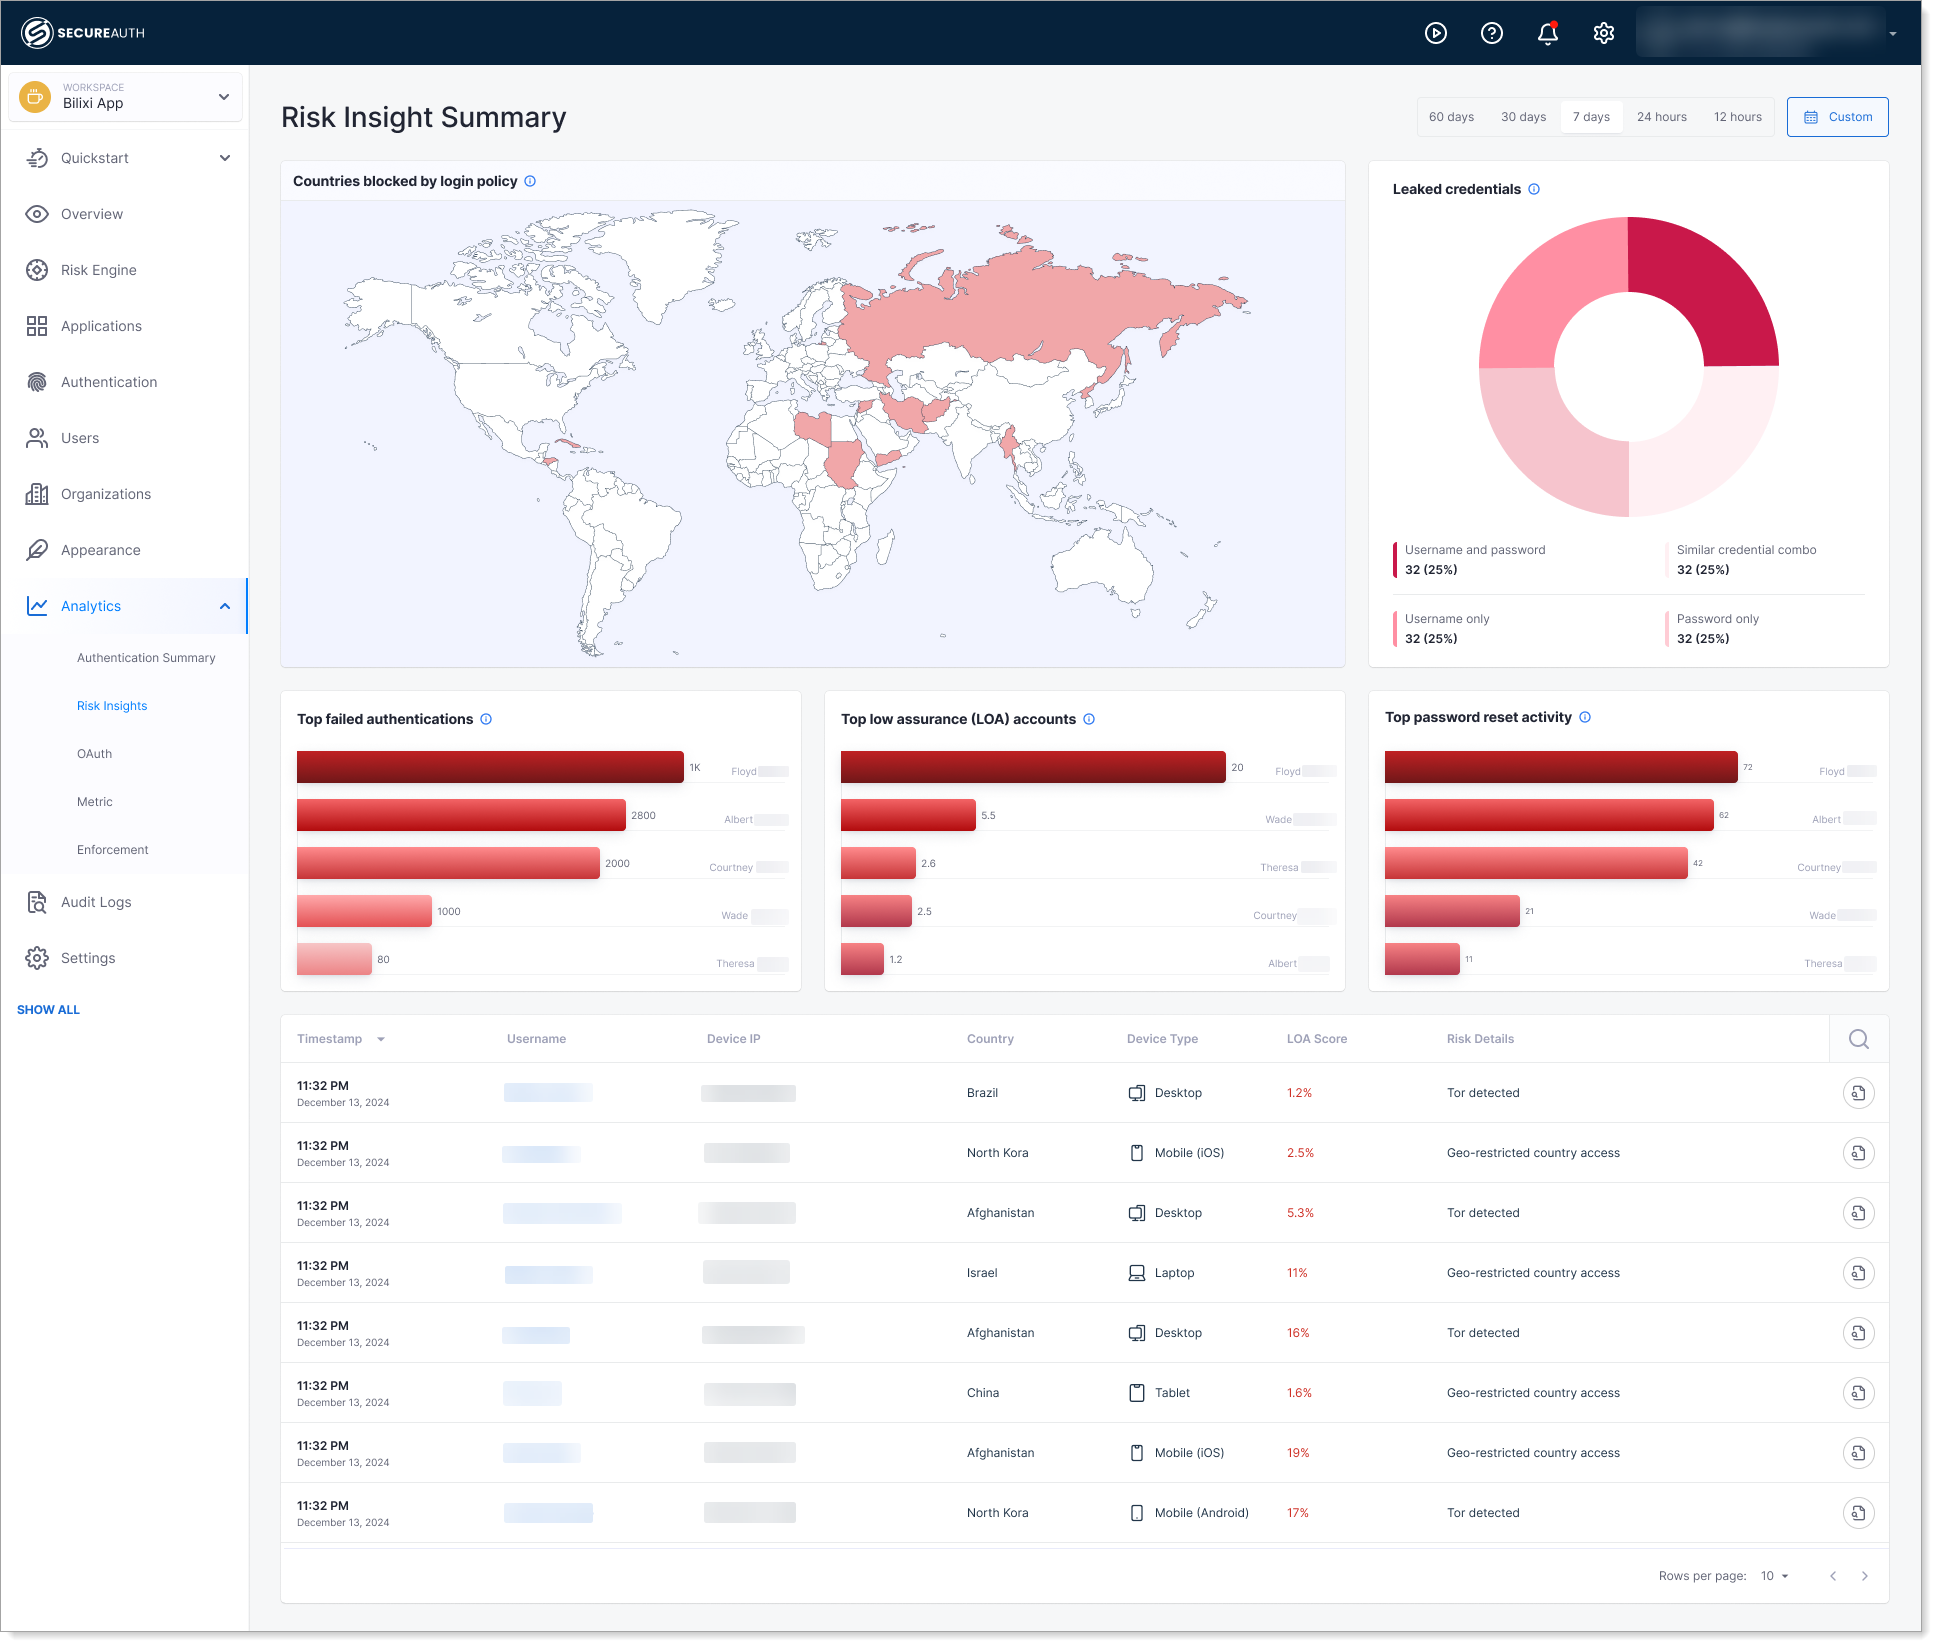
| Countries blocked by security policies | Countries Blocked by Login Policy | Analytics > Risk Insights |
| Accounts with leaked credentials | Leaked Credentials | Analytics > Risk Insights |
| Which authentications are failing | Top Failed Authentications | Analytics > Risk Insights |
| Accounts with low risk scores | Top Low Assurance (LOA) Accounts | Analytics > Risk Insights |
| Password reset requests and activity | Top Password Reset Activity | Analytics > Risk Insights |
| Detailed view of risky events and their risk type | Risk Event Details | Analytics > Risk Insights |
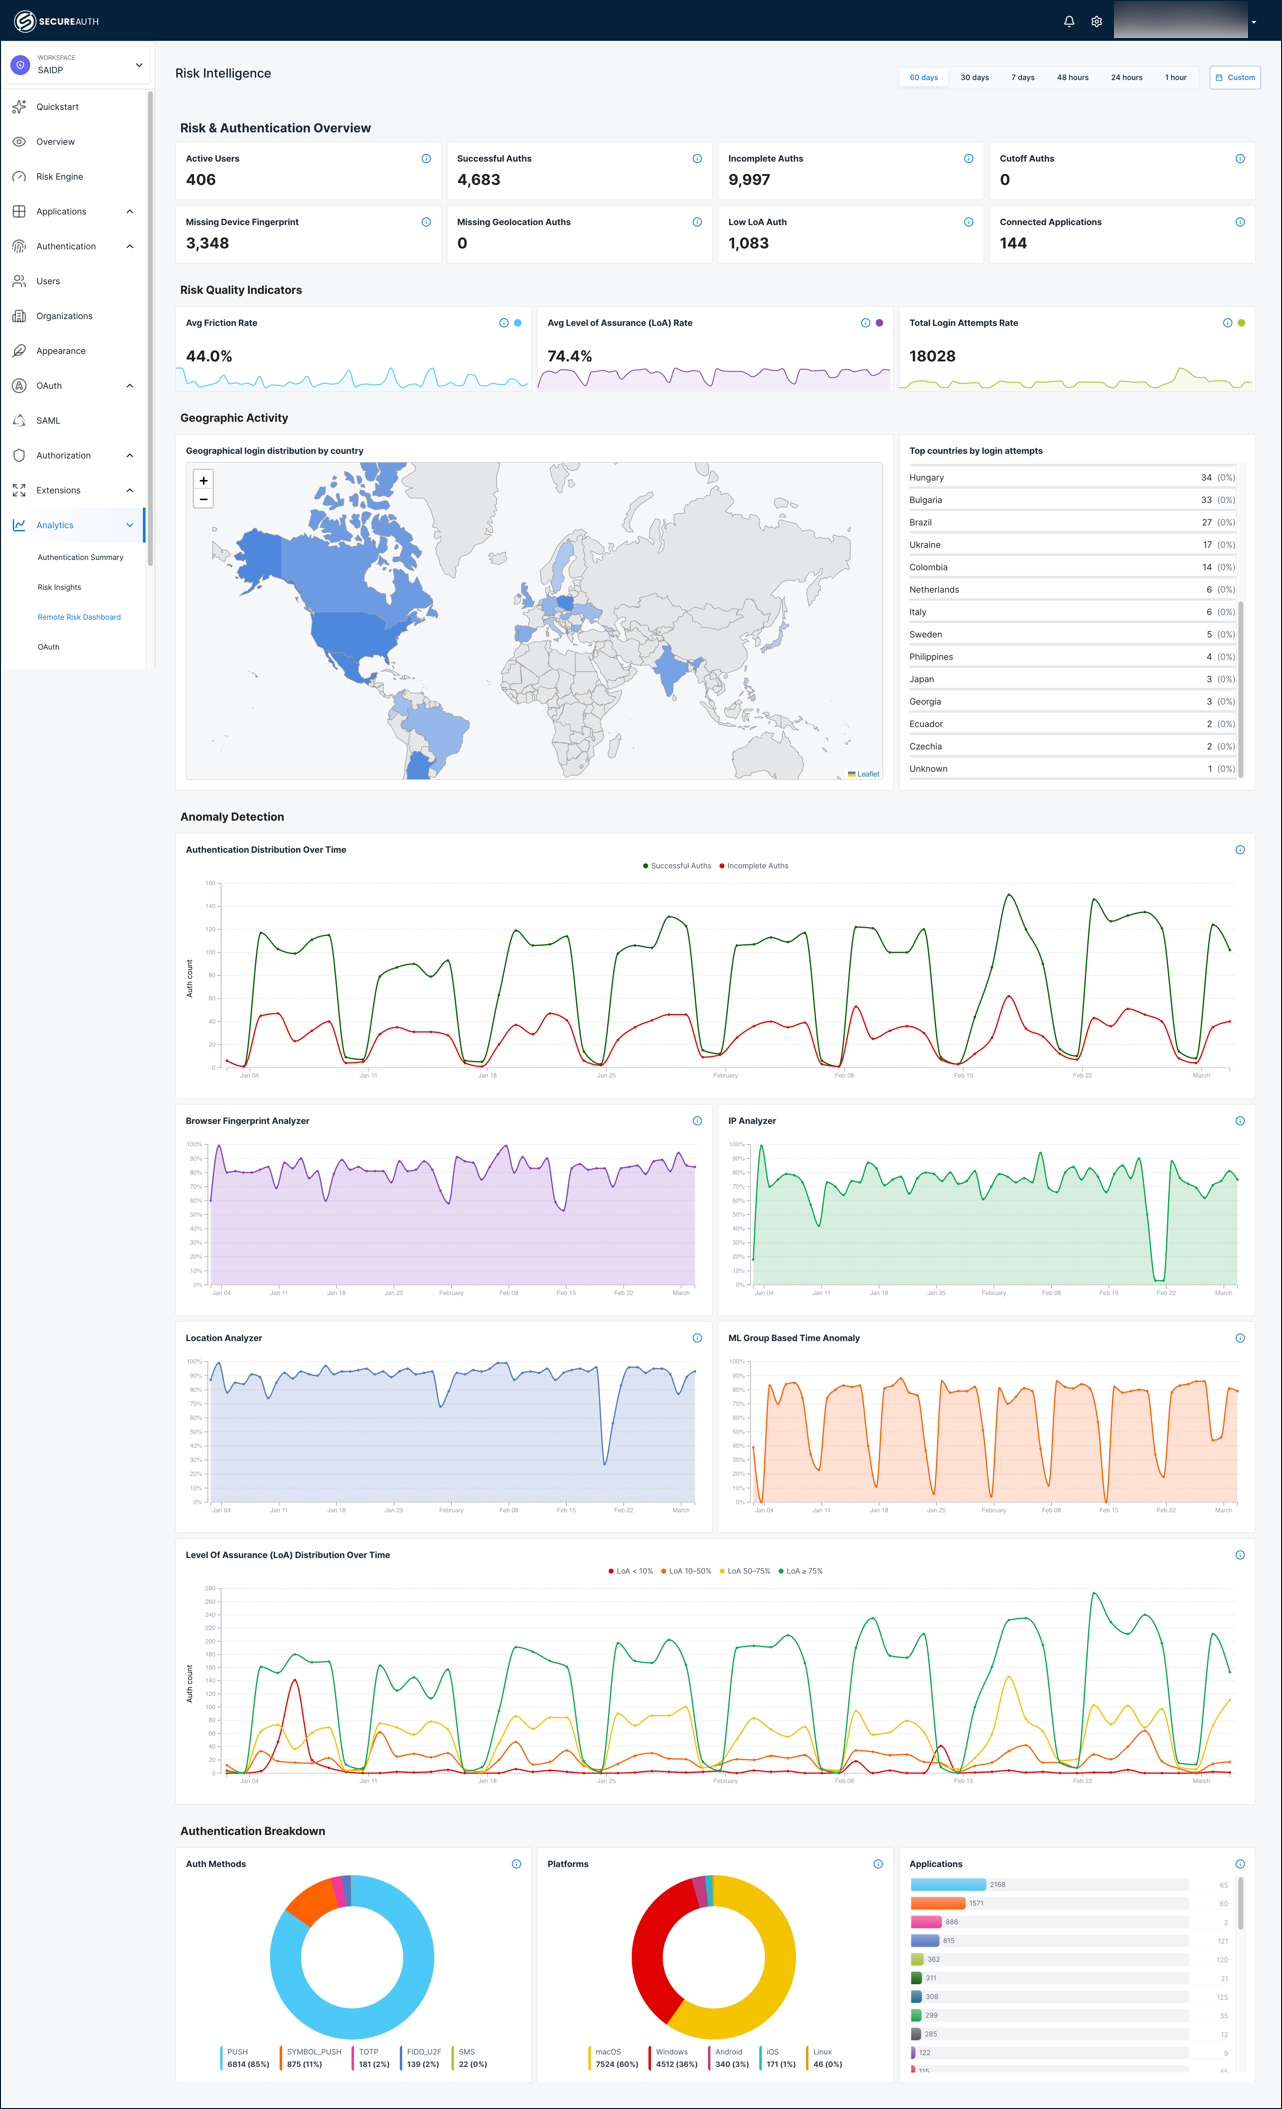
| Risk engine evaluation metrics and LoA scores | Risk & Authentication Overview | Analytics > Remote Risk Dashboard |
| Authentication friction and confidence levels | Risk Quality Indicators | Analytics > Remote Risk Dashboard |
| Where risk-evaluated logins originate | Geographic Activity | Analytics > Remote Risk Dashboard |
| Risk analyzer score trends over time | Anomaly Detection | Analytics > Remote Risk Dashboard |
| Authentication method and platform distribution | Authentication Breakdown | Analytics > Remote Risk Dashboard |
| Individual authentication event details with analyzer scores | Authentication Transactions | Analytics > Remote Risk Dashboard |
| Users and IPs with low LoA scores | Top 10 Risky Users / Top 10 IPs | Analytics > Remote Risk Dashboard |
| Credential stuffing and burst login detection | Anomalous Login Patterns | Analytics > Remote Risk Dashboard |
Choosing the right dashboard
Each dashboard answers a different question. Some data points like geographic distribution and LoA scores appear on multiple dashboards but are presented differently depending on the purpose.
| Question | Dashboard |
|---|---|
| How is our authentication system performing? | Authentication Summary |
| What threats need attention right now? | Risk Insights |
| What is the risk engine seeing and why? | Risk Intelligence |
Authentication Summary is the operations view. Use it to monitor system health, track login volume and success rates, measure MFA and passwordless adoption, and understand what devices and browsers your users rely on. Start here when you want to know if authentication is working properly.
Risk Insights is the threat alert view. Use it to find compromised accounts with leaked credentials, investigate failed login spikes, review policy violations, and identify accounts that need immediate action like forced password resets. Start here when you need to respond to a security incident.
Risk Intelligence dashboard is the risk engine deep-dive view. Use it to understand how the risk engine evaluates each authentication, monitor individual analyzer scores (IP, browser fingerprint, location, ML anomaly), track friction rates against LoA thresholds, and detect credential stuffing or burst login patterns. Start here when you need to investigate why risk scores are changing or tune risk policies.
Common questions answered
Can I export dashboard data?
Dashboard data export is not currently available. To use dashboard insights in reports, you can take screenshots or copy the data from the tables displayed.
How often is the data updated?
Dashboard data is updated hourly. Check your dashboard at the top of each hour for the latest metrics.
Can I filter dashboard data by date range?
Yes. Each dashboard includes date range picker at the top. Select the time period you want to analyze.
Can I customize which charts appear on the dashboard?
No. Dashboard layouts are fixed, but you can focus on the specific charts you need from the reference table above.
What if I don't see data on a dashboard?
Data appears after authentication events occur. New workspaces may take a few hours to populate dashboard data. Check that your workspace has active users and that policies are configured.
Where do I find authentication or risk dashboards in the platform?
Log in to SecureAuth Connect, navigate to Analytics, then select Authentication Summary, Risk Insights, or Remote Risk Dashboard from the left menu.