Dashboard
See your own agents' tool calls, blocks and LLM cost for a time range in the user portal.
In the console: Agent Authority › Dashboard
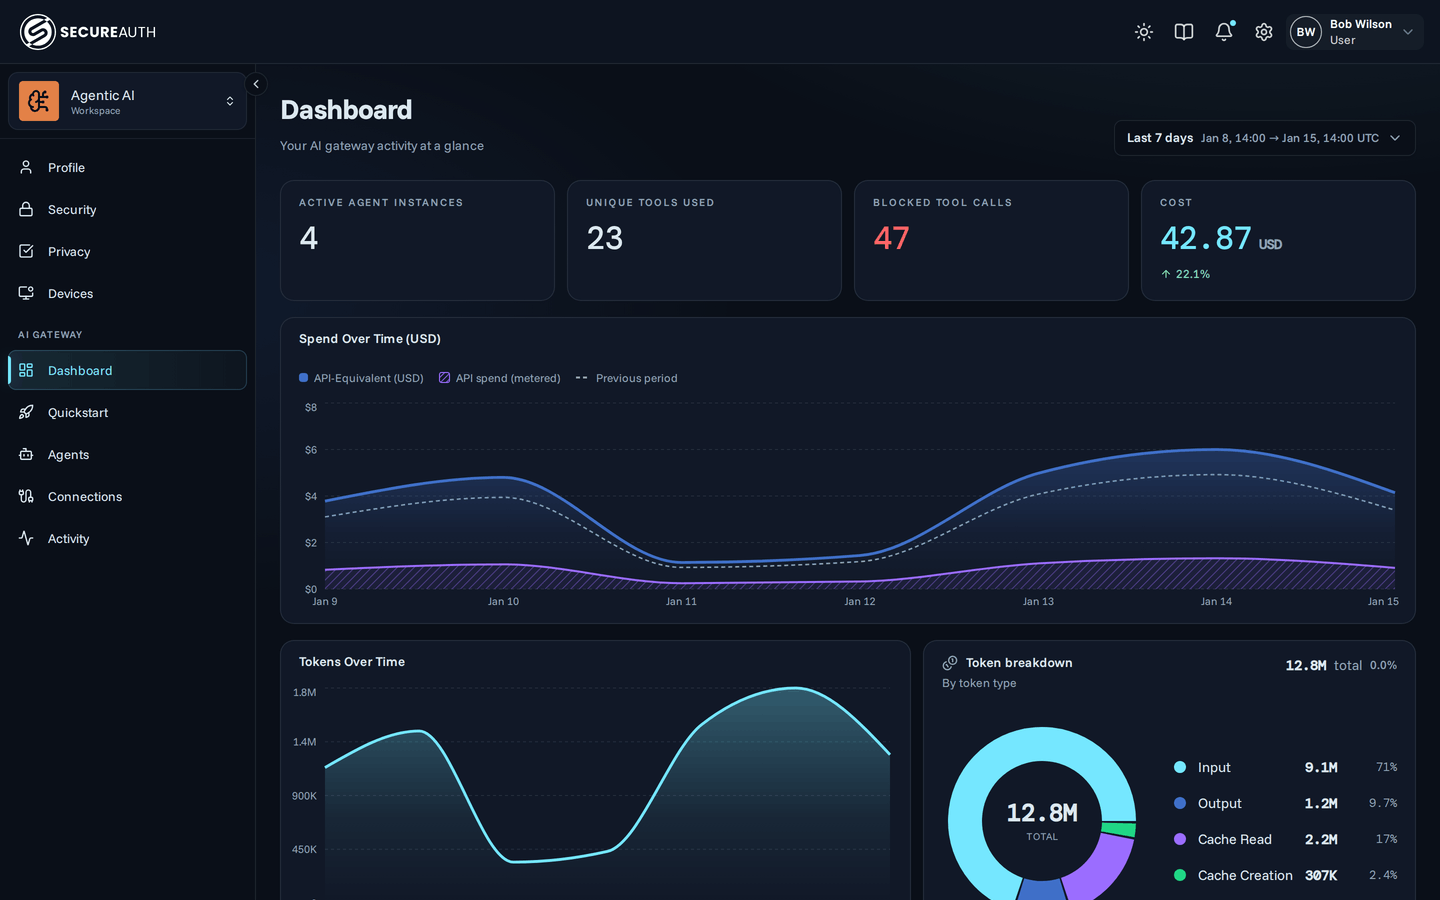
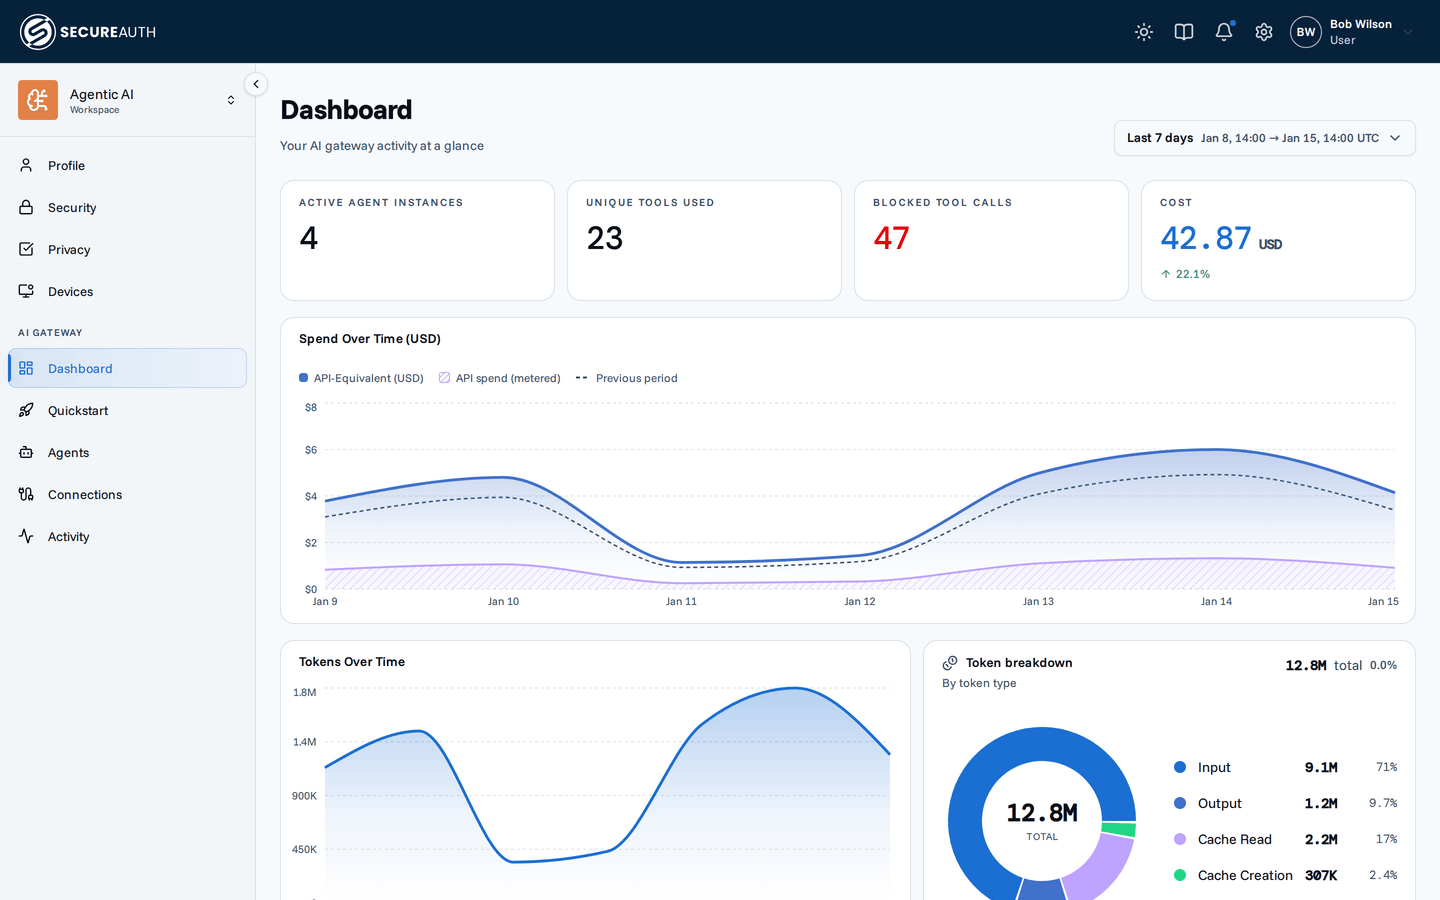
This screen is in the user portal, so it shows what you see when you sign in as a user, not as an admin. It summarizes your own gateway activity: your agent instances, the tools they called, the calls a policy blocked, and your LLM usage. It shows only your activity, even when your role grants org-wide analytics.
Time range
The date range picker in the page header sets the range for every card and chart. It starts at Last 7 days. Choose a preset, such as Last 24h, This week or Last 90 days, or set a Custom range.
Summary cards
| Card | Shows |
|---|---|
| Active Agent Instances | Your agent instances that were active in the range |
| Unique Tools Used | The number of distinct tools your agents called |
| Blocked Tool Calls | Tool calls a policy blocked |
| Cost | The list-price value of your LLM usage in USD, against the previous period. It appears only when you have LLM usage in the range. |
Charts and lists
- Spend Over Time (USD) – your LLM spend across the range, with the previous period. With no LLM usage yet, a No LLM usage yet card takes its place, with a Go to Quickstart link.
- Tokens Over Time – tokens your agents used, with the previous period.
- Token breakdown – tokens by token type, with the total.
- Top Models by Tokens – the models that used the most tokens.
- Tool Executions Over Time – your tool calls across the range, with Blocked calls when there are any.
- Activity by Hour (UTC) – when in the day your agents call tools.
- Top Tools and Top Blocked Tools – the tools called, and blocked, most often.
- Top Agent Instances and Top Blocked Agent Instances – your agent instances with the most calls, and the most blocked calls.
The LLM cards and charts appear only when you have the permission for them and LLM usage in the range.
Actions
This screen is read-only. Change the time range to update every card and chart.
Permissions
The Dashboard menu item needs no permission.
The screen content needs both view_tool_analytics and view_agent_analytics.
Without them, the screen shows "You do not have permission to view this dashboard."
The Cost card and the LLM charts also need view_llm_analytics.
The Go to Quickstart link appears only with view_agent_instances.
Related
- User portal – what the user portal is and who uses it
- End-user guide – the end user's guide to the portal