Anomalies
Spot unusual spend, tool volume, error rates, and off-hours activity, scored against each user's own history
Navigate to Anomalies and Findings to see a triage queue of unusual activity — spend spikes, unusual tool volume, new tools or models, and activity at hours a user has never worked before.
Anomaly detection is enabled per organization. If your organization doesn't have it turned on, the Anomalies and Findings item won't be in the sidebar and the detectors don't run; viewing it also requires the view_anomaly_detection permission. Contact SecureAuth to have it enabled.
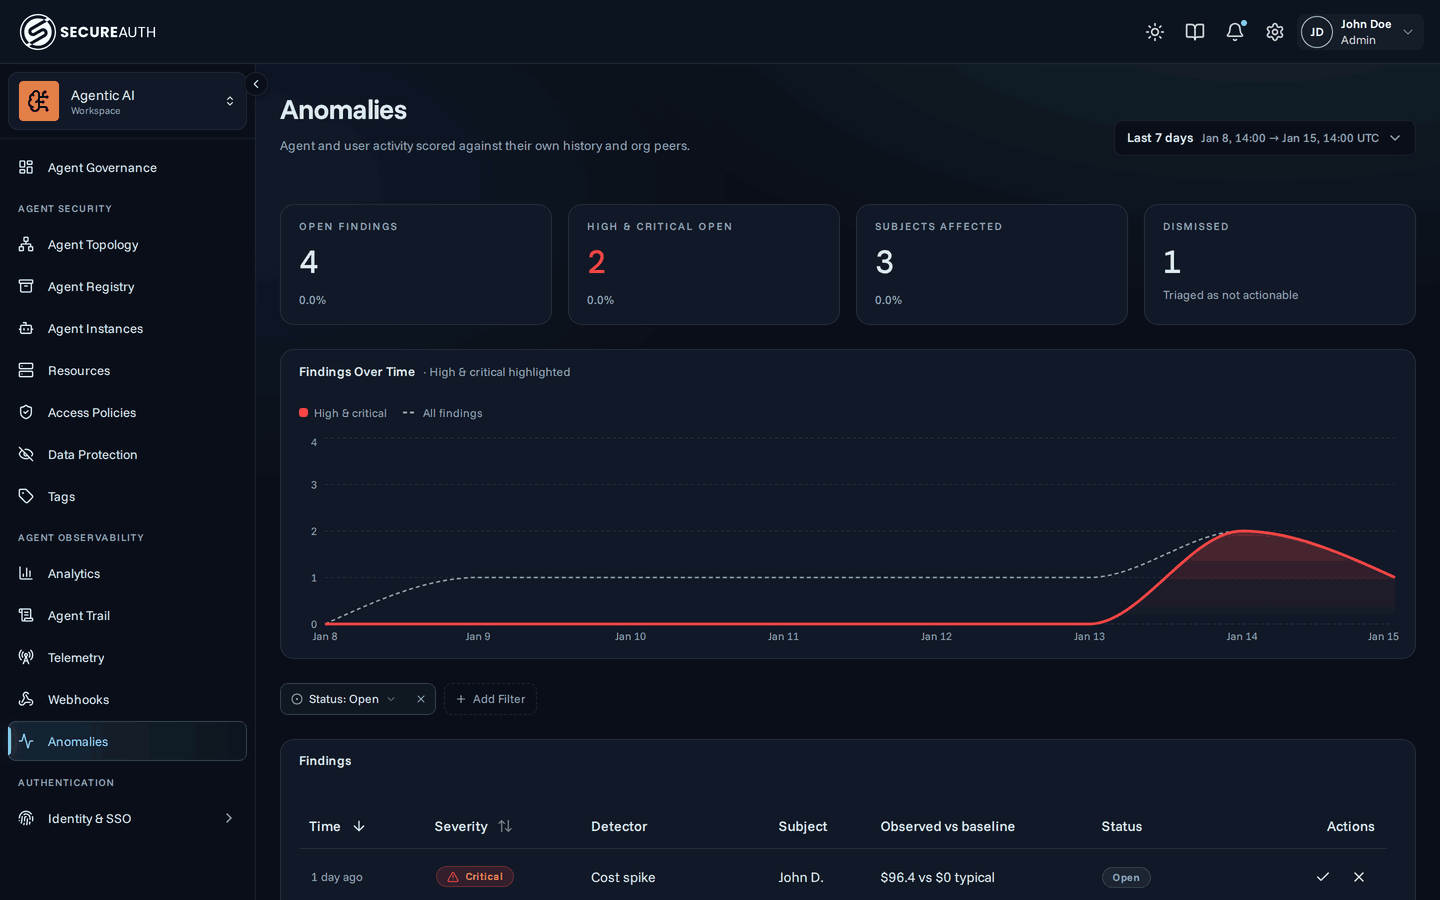
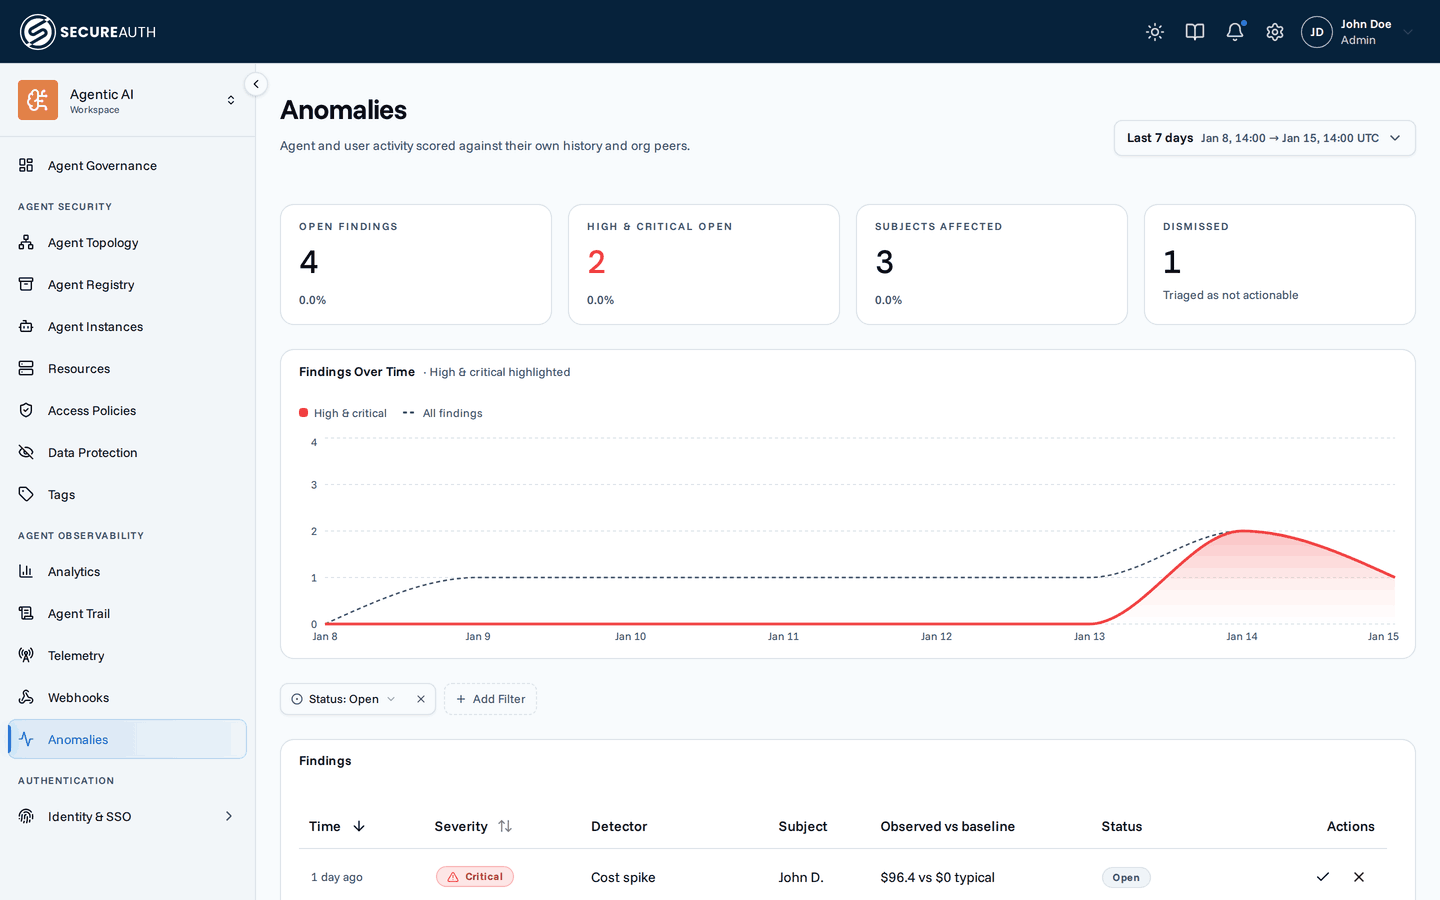
What the page shows
- Headline stats – open anomalies, high & critical open anomalies, subjects affected, and dismissed, for the selected date range
- Anomalies over time – a chart of high & critical anomalies against the total, so a spike in severity stands out from routine volume
- Filters – narrow the queue by Status, Severity, and Detector; filters combine, and the queue defaults to open anomalies
- Anomalies table – one row per anomaly: when it last fired, severity, detector, subject, the observed value against its baseline median, and status, with inline Acknowledge / Dismiss actions
Click any row to open the anomaly drawer. A Why flagged panel leads with the rationale in prose and the numbers that matter for triage: the observed value, the subject's typical (median) value, the multiple between them, and the peer rank where one applied. Affected entity identifies the subject and the slice its baseline was drawn from. For the baseline detectors, a collapsible How we detected this section holds the statistics behind the score — robust score, z-score, baseline median, and median absolute deviation (MAD). A chart plots the subject's metric history around the anomaly for every detector except the novelty ones, which have no series to show.
Detector families
Every scored detector compares a subject (a user or an agent instance) against its own historical baseline, upward only — a dip below baseline never fires. The cost and volume spike detectors additionally require the value to clear the subject's own historical ninetieth percentile; the error-rate detector fires on any rate above its baseline median that clears the deviation threshold. How the score turns into a severity is described below the table.
| Detector | What it compares | Default sensitivity |
|---|---|---|
llm_cost_spike | A user's daily LLM spend against their 90-day baseline | 4.5× robust deviation |
mcp_volume_spike | A user's or agent's hourly tool-call volume against the same hour of day historically (60-day baseline) | 3.5× (agents 5×) robust deviation, min 30 calls |
mcp_error_rate | A user's hourly tool-call error rate against their trailing rate (30-day baseline) | 3.5× robust deviation, min 20 calls and 5 errors in the hour |
mcp_blocked_spike | A user's or agent's hourly count of policy-blocked calls against a fixed floor — no historical baseline | ≥10 fires (medium), ≥25 is high |
new_tool_for_user | Whether a user has used a given tool in the last 90+ days | Rolled up per (user, MCP) episode; a tool that's also new for the whole org additionally gets its own anomaly |
new_mcp_for_user | Whether a user has connected to a given MCP server in the last 90+ days | First use after 90+ days of dormancy |
new_model_for_user | Whether a user has used a given LLM model in the last 90+ days | Rolled up per user into one anomaly listing every new model |
off_hours_activity | Whether a user has ever been active at a given UTC hour — or either adjacent hour — in the last 60 days | First activity in that hour, minimum 15 calls; needs 14+ hours of prior history, so new users never fire it |
The volume detector scores users and agent instances separately with independent thresholds (agents run hotter), and drops an agent-instance anomaly that's an exact duplicate of the same bucket's user anomaly.
Severity bands the robust score — low (any score that fires), medium (8), high (20), critical (40) — then escalates one band when the subject is also the most extreme value among at least 20 organization peers, and finally holds the result one band lower when the value stayed below the subject's own historical maximum (a heavy-tailed subject's below-its-own-record day reads as "high," not "critical").
mcp_blocked_spike is the exception: a plain threshold with no historical baseline (a policy-blocked call is already a bright line), banding severity directly on the observed count instead of a robust score.
Anomaly lifecycle
- Open – created the first time a detector flags an episode (one detector, subject, metric, and dimension). A recurrence of the same episode while it's still open, acknowledged, or dismissed updates that same anomaly in place — refreshing its evidence and escalating severity if the new occurrence is worse — rather than creating a duplicate.
- Acknowledged / Dismissed – a reviewer's triage decision from the table or the drawer. Both are reversible with Reopen.
- Resolved – set automatically once an episode's subject stops reappearing for three consecutive scoring passes (a "clean streak"). Resolved anomalies are immutable and drop out of the episode-matching key, so if the same detector and subject fire again later, it starts a new anomaly rather than reopening the old one. They are pruned after 120 days.
Detectors run about every 15 minutes, so an anomaly appears within about 15 minutes of the activity that triggered it.