Analytics
Analyze how tool usage, LLM token usage, and policy decisions trend over time, so you can catch cost and behavior changes early
The audit log shows individual events; Analytics aggregates them into trends, so you can spot a usage spike, cost drift, or a surge in policy blocks before it becomes an incident. Navigate to Enforcement Traffic to see aggregated data over time. The page has three tabs: MCP Usage, LLM Usage, and Security.
MCP Usage
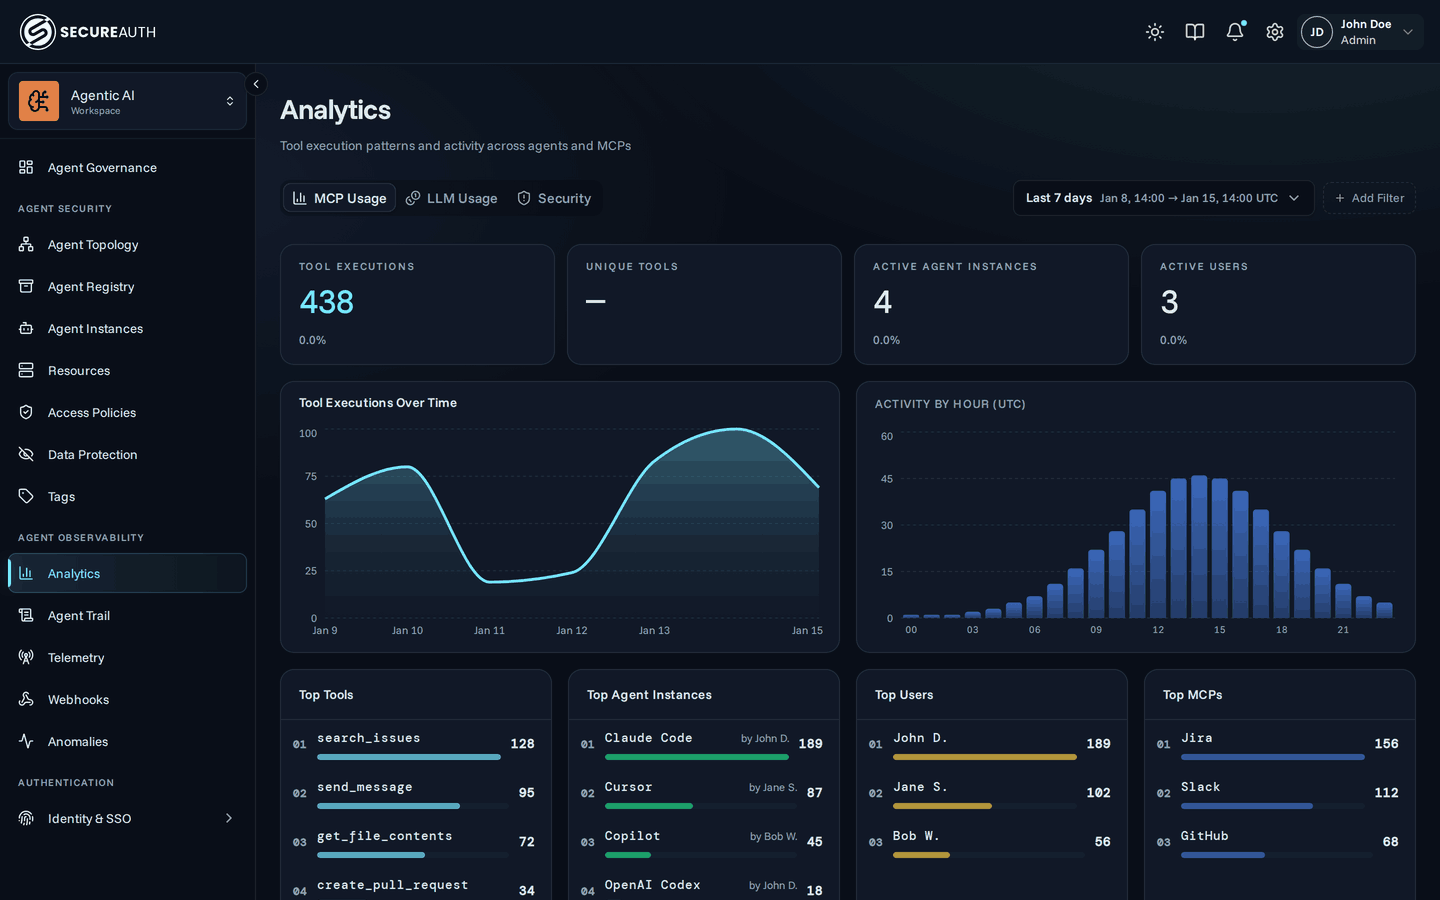
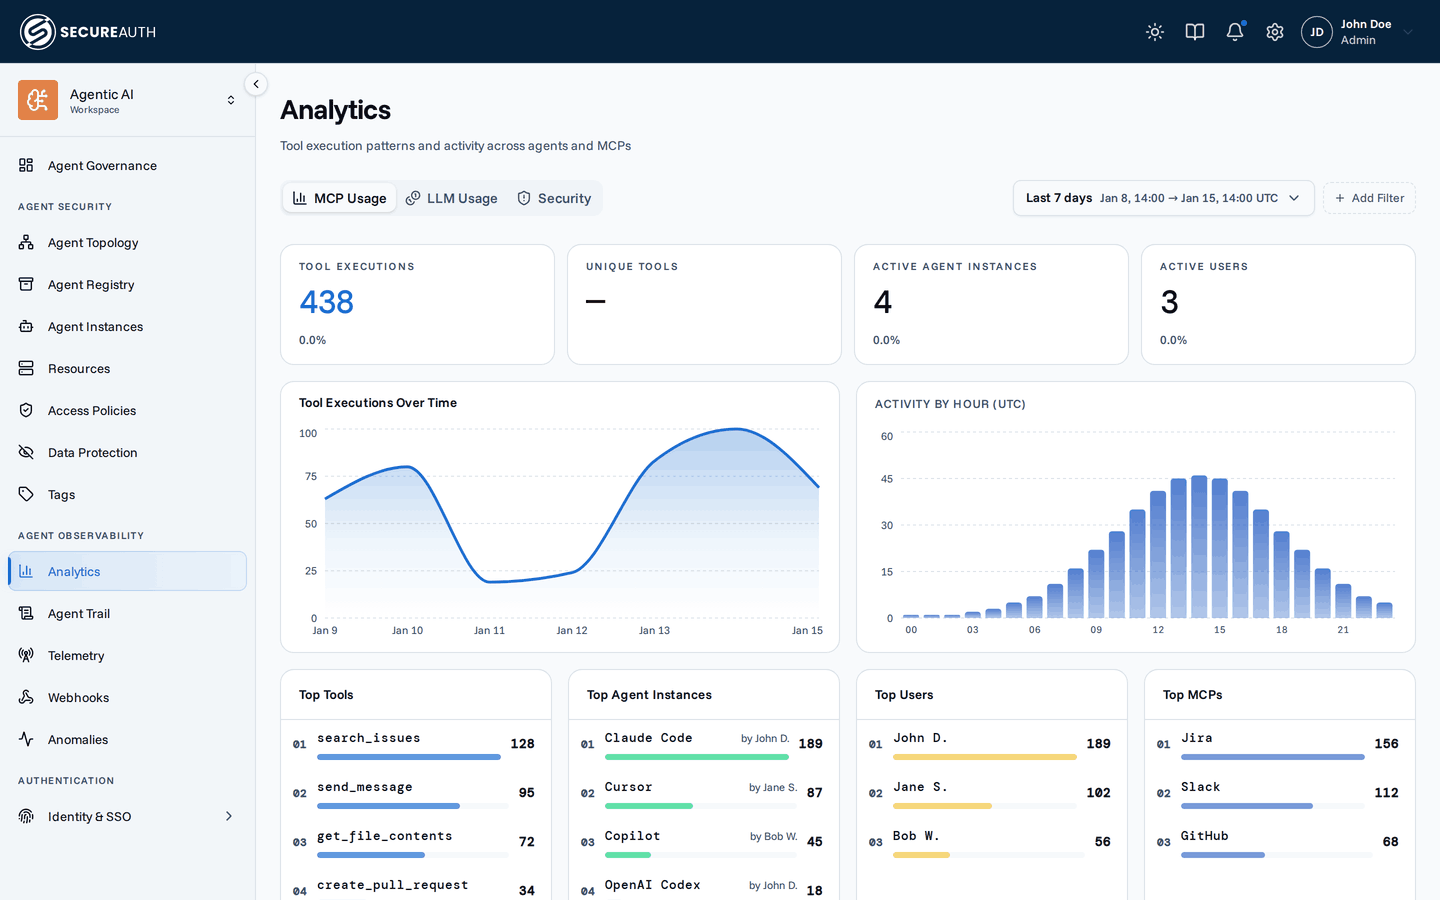
Tool-call activity across all agents and MCP servers:
- Tool executions, unique tools, active agent instances, active users – headline counts for the selected period
- Tool executions over time – line chart of activity trends
- Hourly distribution – tool call volume by hour of day (UTC)
- Top tools – most frequently called tools, with the owning MCP (paginated, 10 per page)
- Top agent instances – most active agents by execution count, with the owning user (paginated, 10 per page)
- Top users – most active users by tool execution count (paginated, 10 per page)
- Top MCPs – most used MCP servers (paginated, 10 per page)
LLM Usage
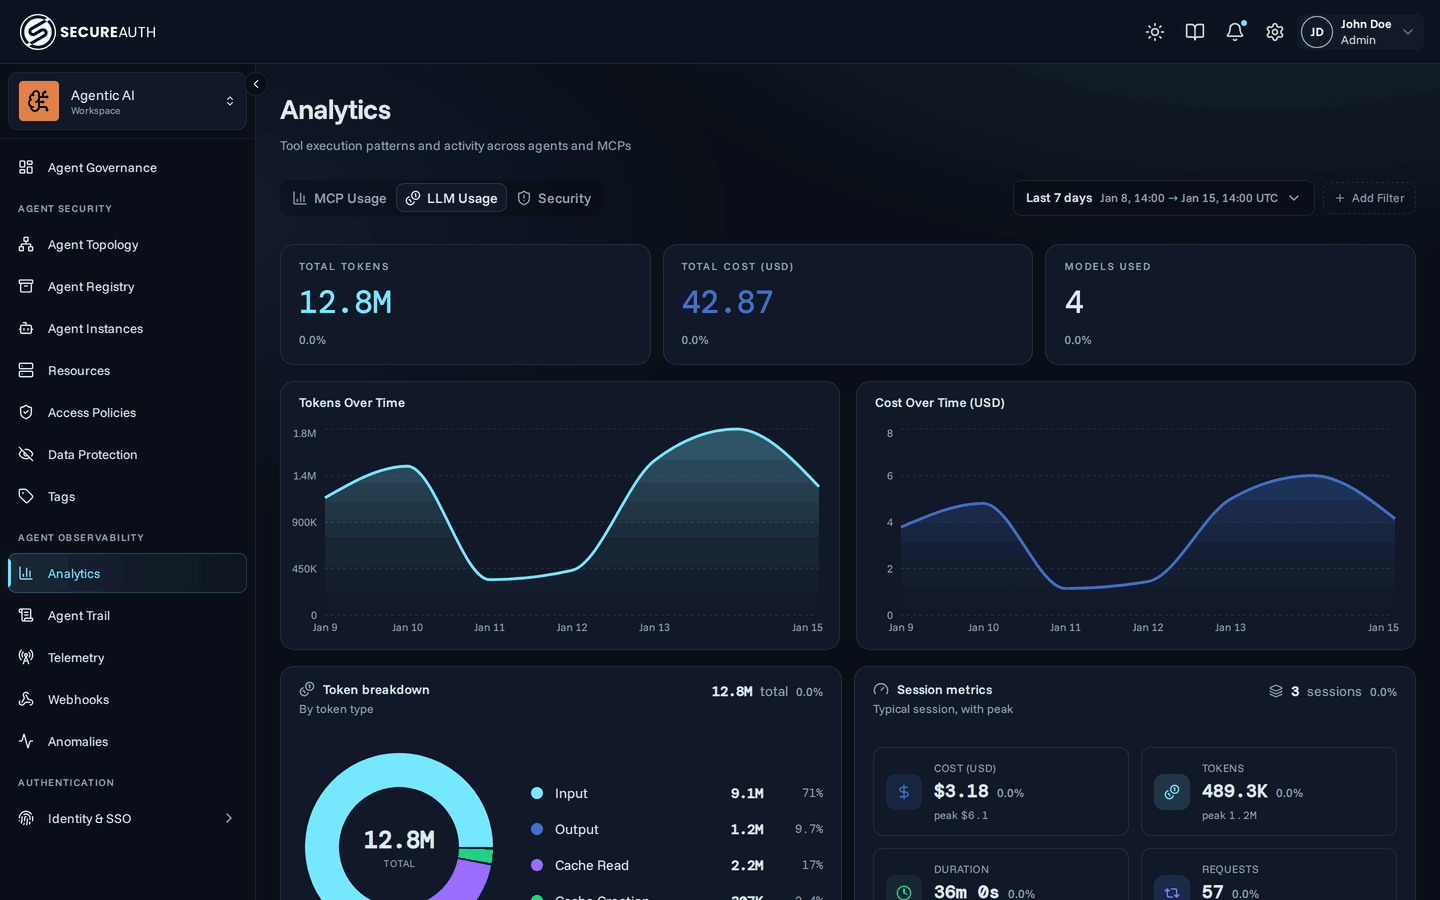
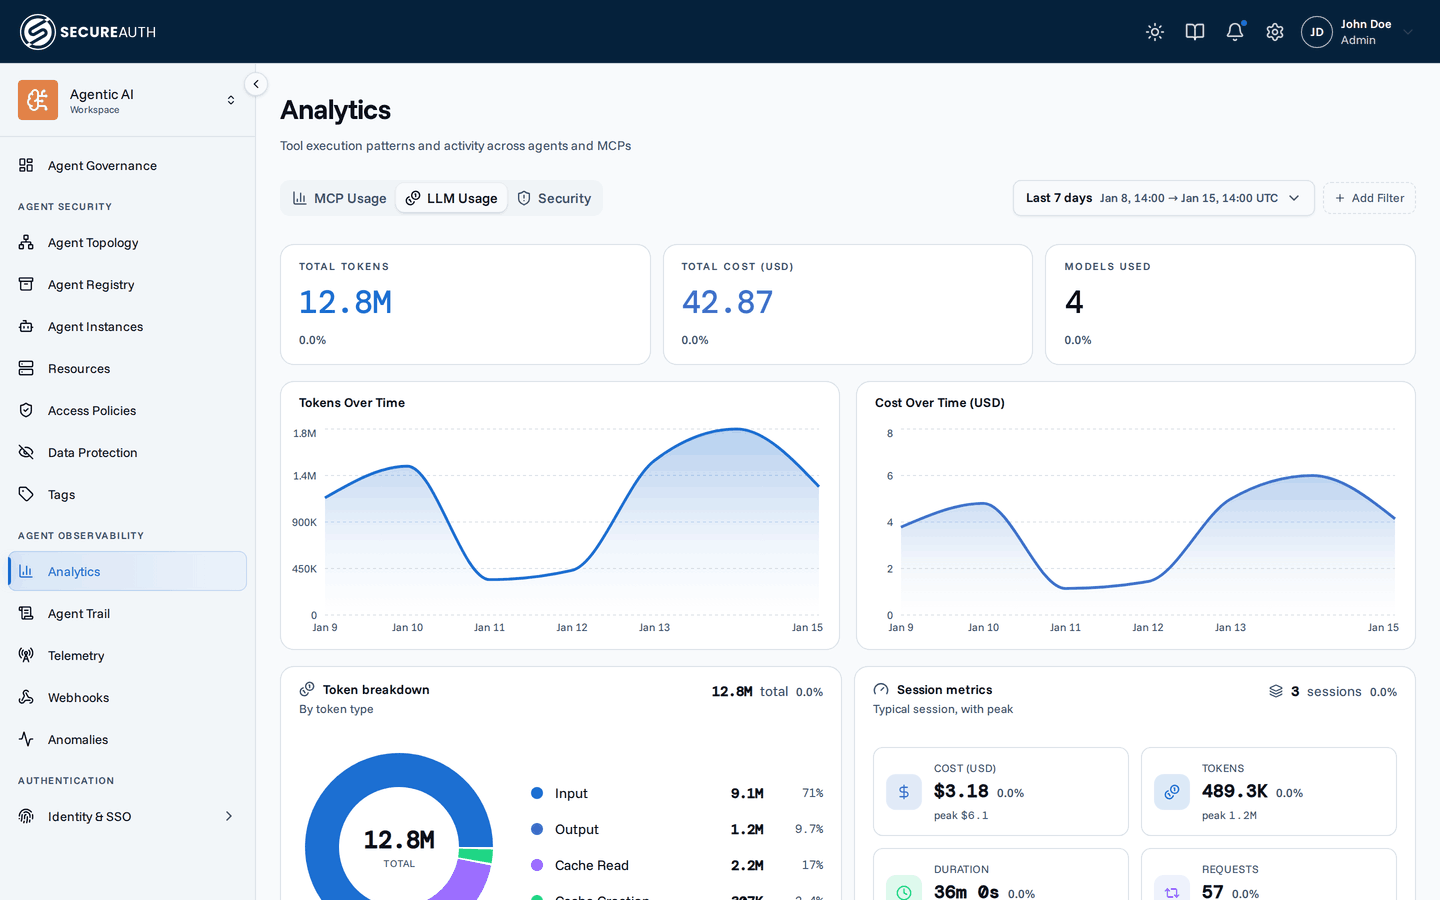
Token consumption across your coding agents, powered by OpenTelemetry data they send to the gateway. This tab is deliberately dollar-free — every cost measure lives on the dedicated Cost page:
- Total tokens and models used – headline figures for the selected period
- Tokens by type – usage split across input, output, and cache token types
- Tokens over time – a line chart of consumption trends, overlaying a hatched API-key series over the total so you can read the metered-usage share against the whole at a glance
- Top Users by Tokens and Top Models by Tokens — which users and models consume the most (paginated, 10 per page)
This tab is visible to admins with the LLM-analytics permission. Until your agents are configured to send telemetry, it shows an empty state linking to the Discovery Sources page — see the OpenTelemetry guide for how to connect Claude, Codex, Copilot, and Gemini CLI, including turning it on org-wide.
Auth mode: subscription, API, or unknown
Every usage row is classified by auth mode — how the session authenticated: subscription (a logged-in account seat), api (a metered API key), or unknown when the signal is missing. Codex and Gemini CLI report this explicitly, and Copilot is classified by the model provider it names; Claude infers it from whether account identity is present on the telemetry (present means subscription, absent means API key). Use the Auth mode filter to narrow any chart or table to one bucket.
Auth mode is a provable authentication path, not a billing-truth signal — telemetry has no field for whether a given request landed within a subscription's included usage or spilled into overage, so treat it as a proxy for billing mode rather than the mode itself. The dollar measures built on this split (real spend, API-equivalent, savings) live on the Cost page.
The Sessions area doesn't carry this dimension: per-session rows aren't split by auth path in v1, so the Auth mode filter has no effect there.
Per-session usage
The Sessions table ranks individual agent sessions by token consumption or recency. Each session reported by an agent becomes one row in the table.
Click any row to open the Session timeline drawer. Alongside the session's totals, model breakdown, and token mix, it charts tokens over time (bucketed, so you can see when the agent was working hard versus idle). A per-model rollup drives the Models card and average latency. Below the charts, a Requests table lists the session's individual requests — time, model, token split, duration, and prompt — 20 rows per page.
Note: For Claude, session totals come from telemetry metrics while the request timeline is built from telemetry logs — if a Claude agent exports only metrics, its totals appear but the drawer asks you to enable the OpenTelemetry logs exporter. Codex and Gemini CLI sessions are built entirely from their event logs, so either agent exporting only metrics produces no session row at all. Copilot sessions are built from its trace spans, grouped by the conversation id it reports, or by the parent chat session id when a background call reports no conversation of its own.
Session metrics
Above the Sessions table, the Session metrics panel summarizes the distribution of sessions that match the current date range and filters. For each of the three dimensions — tokens, duration, and requests — it shows the median as the headline figure with the P95 peak beneath it, alongside the session count; each figure carries a delta against the previous period. Dollar figures live on the Cost page, so this panel is deliberately dollar-free. This lets you see at a glance what a "normal" session looks like and how far the tail extends.
The panel respects the same provider, model, user, and date-range filters as the rest of the LLM Usage tab, so you can narrow it to a single model or user and immediately see how their sessions compare to the broader baseline.
The session drawer is dollar-free in v1: it reports tokens, duration, and model mix, but no per-session cost. Every dollar-denominated figure — including per-session — lives on the Cost page.
Where this session lands
The session drawer includes a Where this session lands panel that answers "was this session unusual?" without making you scan raw numbers. It opens with a plain-language verdict — "A typical session - close to your org's median on every metric" or "An ordinary session that spiked - top 3% on tokens" — then plots the session on one lane per dimension (Requests, Tokens, Duration).
Each lane is a percentile axis running from quietest to heaviest, with a shaded band for the common range (P10–P90), a darker band for the typical range (P25–P75), and a spine at the median. A dot marks where this session sits, and a caption gives its rank — top 5%, bottom 8%, 57th pct. Ranks are clamped to what the sample can support, so a small org can't be told "top 1%" out of eight sessions. Sessions at or above P95 are highlighted in amber, but only once the baseline holds at least 20 sessions — below that the position is shown without the outlier treatment.
The comparison is independent of the tab's filters: the session is ranked against all of your organization's sessions in the panel's own window, which you toggle between 7d, 30d, and 90d. The header reads "ranked against N sessions" so you always know the sample size. With fewer than two sessions to compare against, the panel says so rather than comparing.
Security
The Security tab surfaces tool calls that were blocked by policy — useful for investigating which agents are hitting policy boundaries and which policies are doing the most enforcement.
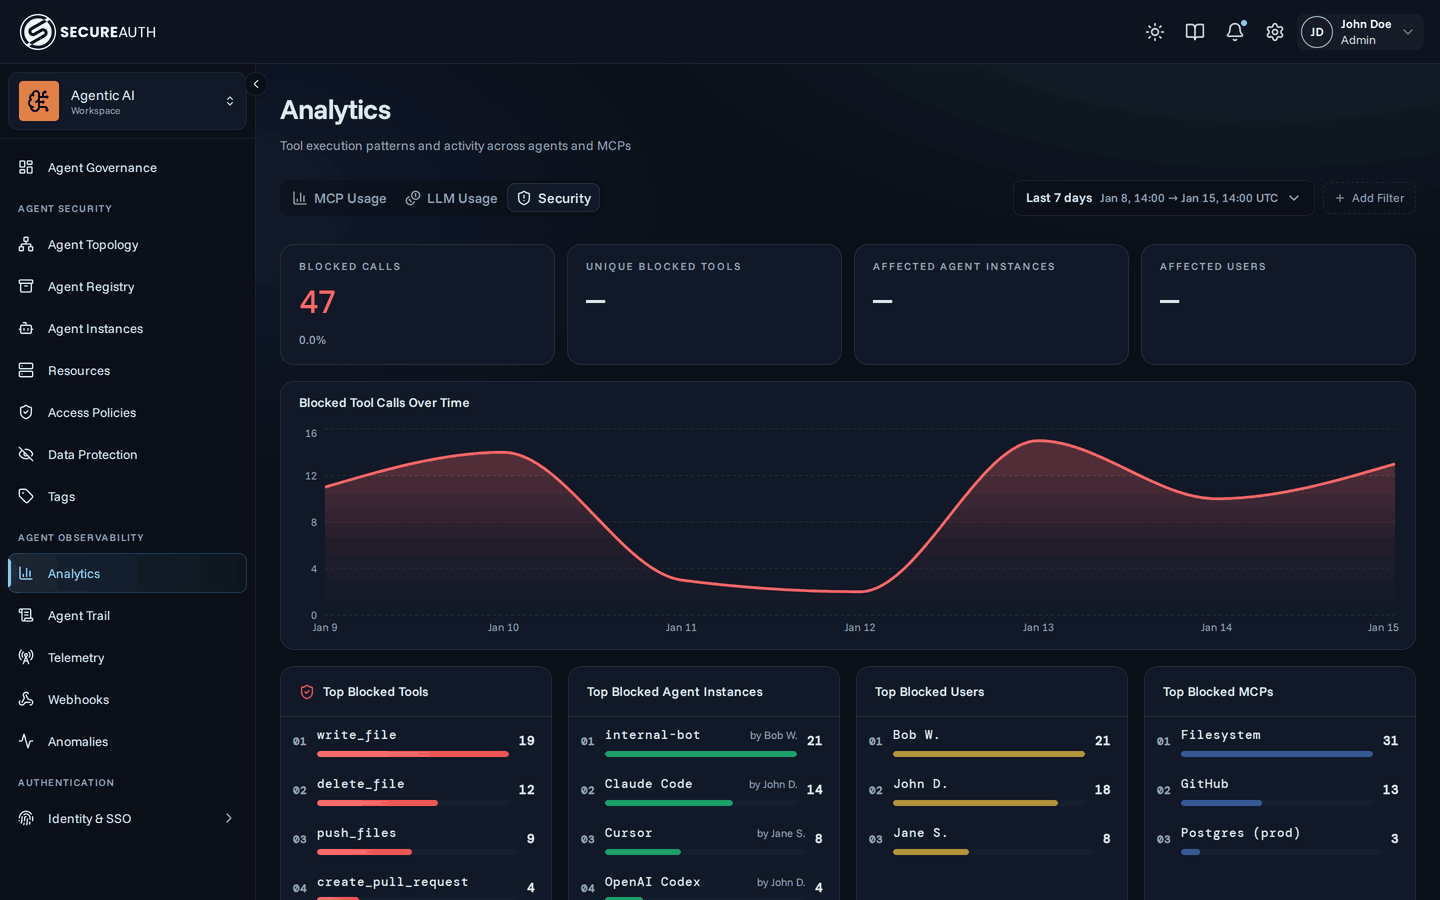
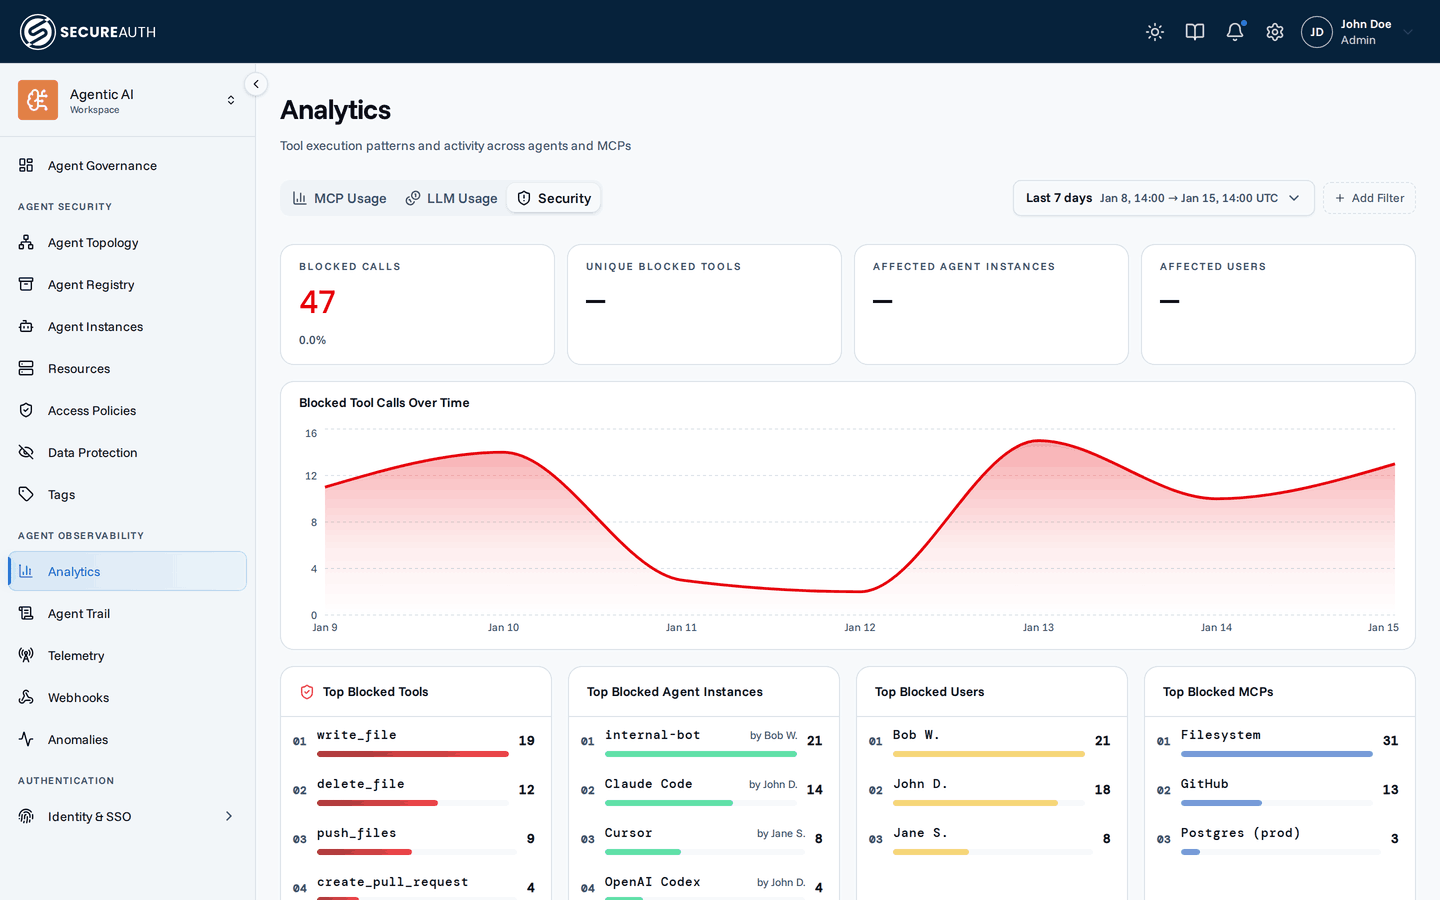
- Blocked calls, unique blocked tools, affected agent instances, affected users – headline counts for the selected period: how many calls were stopped, how many distinct tools they hit, and how much of your fleet ran into a policy wall
- Blocked tool calls over time – line chart showing when blocks happen
- Top blocked tools / agent instances / users / MCPs – what's hitting policy walls (paginated, 10 per page)
- Top blocking policies – which policies are doing the most enforcement (paginated, 10 per page)
Each blocked tool event in the audit log references the policy that caused the block (id, name, description), so you can identify the responsible policy even if it has since been modified or renamed.
Filters
Every tab shares the date-range picker (see below) and User and Group filters. Selecting one or more groups narrows the charts to their current members — membership is evaluated as it stands today, the same way the User filter works. Each tab then adds the dimensions specific to its data:
- MCP Usage and Security — agent-instance, agent, MCP, and tag filters (an Agent tag chip scopes to agents carrying it; a Resource tag chip to the MCP servers and tools carrying it).
- LLM Usage – Provider, Model, and Auth mode.
Filters combine.
Date-range picker
The picker defaults to Last 7 days and offers two preset groups plus a custom mode:
- Rolling – a trailing window ending now:
Last 1h,Last 24h,Last 7 days,Last 30 days,Last 90 days. The window is anchored when you pick it and re-anchors to now when you reload the page or re-select a range — it does not advance while the page sits open. - This (period-to-date) — from the start of the current calendar period to now, growing as the period progresses: Today, This week, This month, This quarter, This year.
- Custom – pick an exact start and end via a dual-calendar with time-of-day, useful for investigating a specific incident window.
Times are shown in your local timezone, and the time-series bucket size is chosen automatically (hourly for spans up to two days, otherwise daily). Each over-time chart overlays the equivalent preceding window as a dashed Previous period series, and the headline cards show deltas against it, so you can see trends at a glance.
The selected range is encoded in the page URL, so you can bookmark or share a specific view and it reloads exactly as you left it.
Next steps
- Dashboard – the same headline numbers, one page up.
- Audit log – drill into the individual events behind any trend.
- OpenTelemetry – connect Claude Code, Codex, Copilot, and Gemini CLI to populate LLM Usage.