Audit log
Review a complete, event-by-event record of what each agent did to trace exactly what happened and when
In the Agent Authority console this page is labeled Agent Trail.
SecureAuth Agent Authority logs every action that passes through it. The audit log provides a complete, queryable record of what happened, when, and who was involved — the evidence trail behind every policy decision.
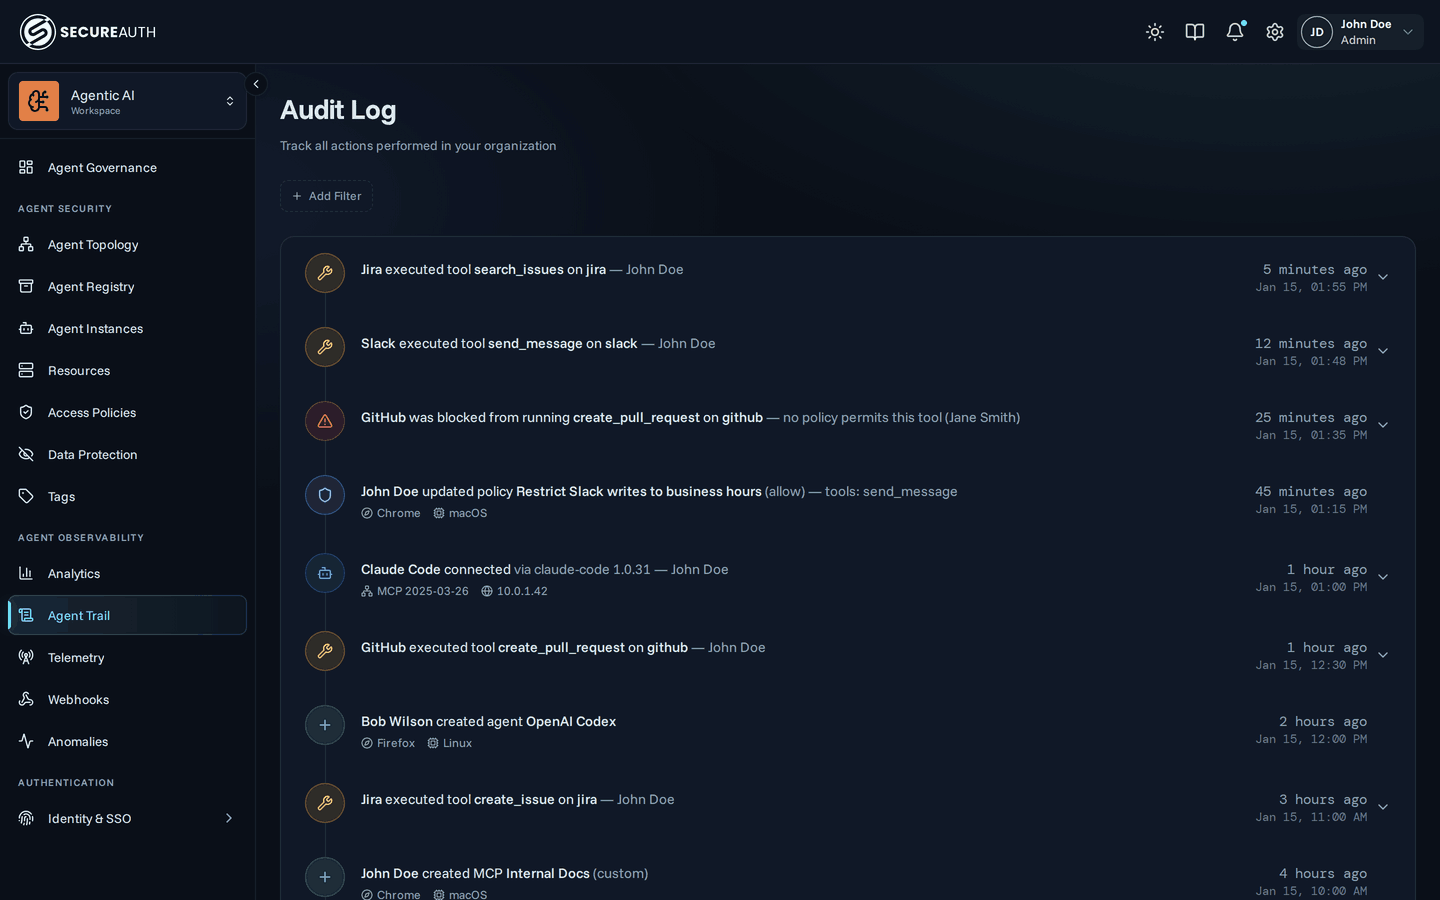
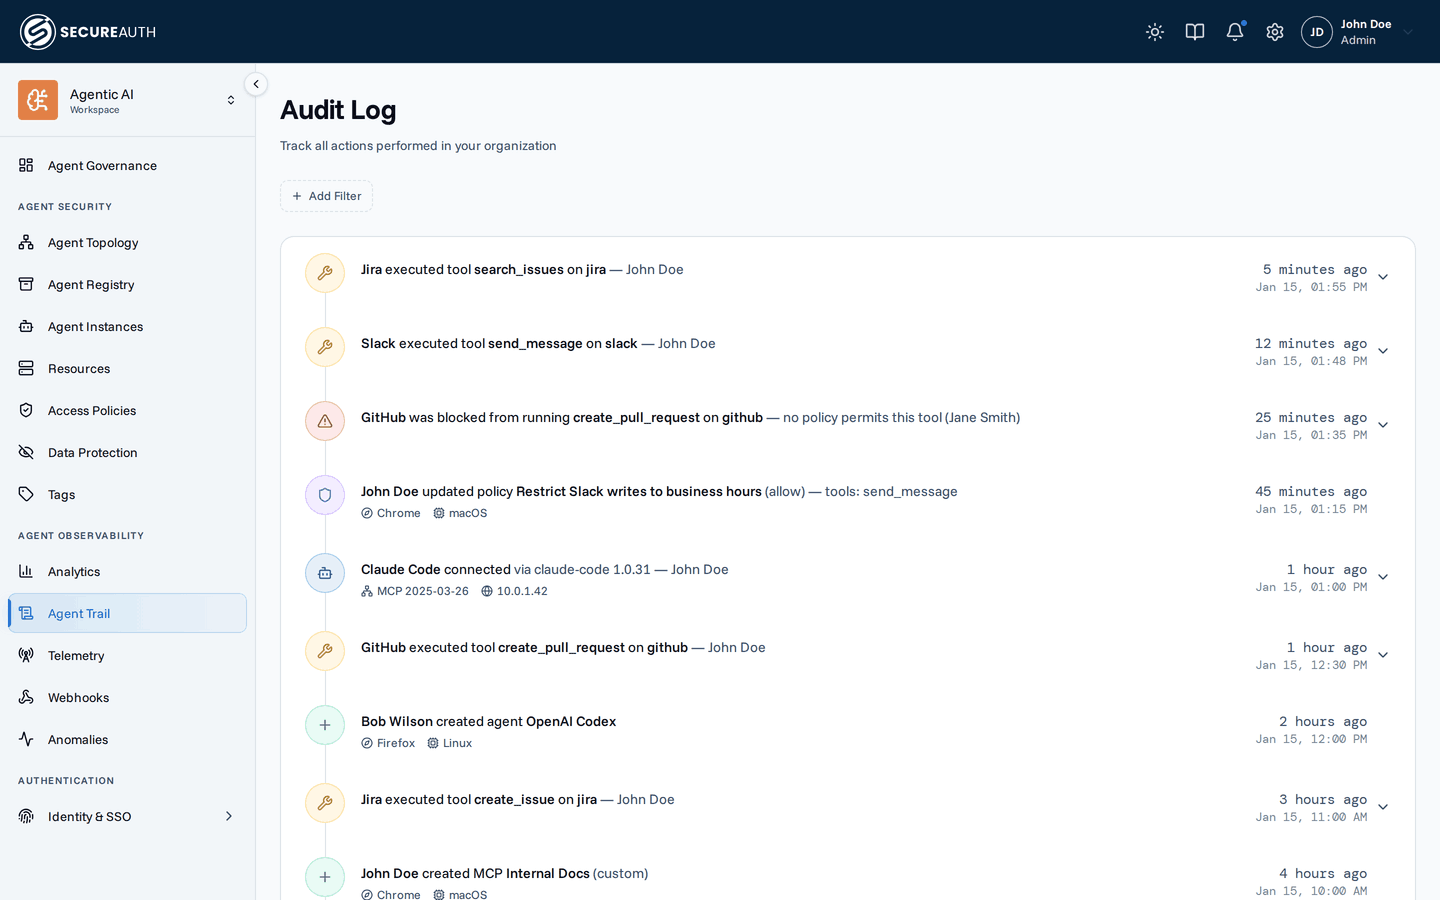
What gets logged
The audit log captures events across the entire gateway:
- Tool executions – every tool call made by an agent, including the tool name, MCP server, and whether it succeeded or was denied
- Tool errors – failed tool calls with error type and description
- Redactions – which response filters redacted a tool response, and how many spans each one matched
- Agent events – agent creation, updates, revocation, deletion, and a connection event each time an agent starts an MCP session, with client metadata
- Resource events – MCP server creation, updates, and deletion
- Policy events – policy creation, updates, reordering, and deletion with rule details
- Connection events – user OAuth connections created, removed, and revoked
- Data protection events – response filter rule creation, updates, and deletion
- Tag events – tag creation, updates, and deletion, plus tag assignments to MCPs, tools, and agents
- Webhook and telemetry events – webhook creation, updates, and deletion; telemetry ingest keys created and revoked
- Anomaly events – anomalies detected, escalated, resolved, and triaged
- Subscription pricing events – seat prices and plan assignments set, ended, and deleted; because a rate change is recorded as a new effective-dated row, the entry carries a field-change diff naming the rate it replaced
Events age out: the audit store keeps three months of history, so move anything you need as long-term compliance evidence somewhere else before it expires. Webhooks forward events to a SIEM or another system as they happen, which keeps a copy outside the three-month window.
Event details
Each audit log entry includes:
- Timestamp – when the event occurred
- Actor – the user or agent that performed the action
- Action – the event type (for example,
gateway.tool.executed,policy.created) - Resource – the MCP server, agent, or policy involved
- Details – action-specific payload (tool name, error type, policy effect, etc.)
Rows with more to show (agent connections, tool calls, and configuration updates that carry a field-change diff) have a chevron; click it to expand a detail panel. (Anomaly rows link to the anomaly drawer instead.) Agent connection events list every server the agent could reach and every server it was blocked from. Expand a server to see its tools, grouped under the rule that decided them. Each tool is allowed outright, conditionally allowed by an argument-level condition that's re-evaluated on every call, or denied. Each rule name links to the rule in Agent Actions. Tools that match no rule appear under No matching rule · default deny. A blocked server names the rule that blocked it, or says no rule grants access.
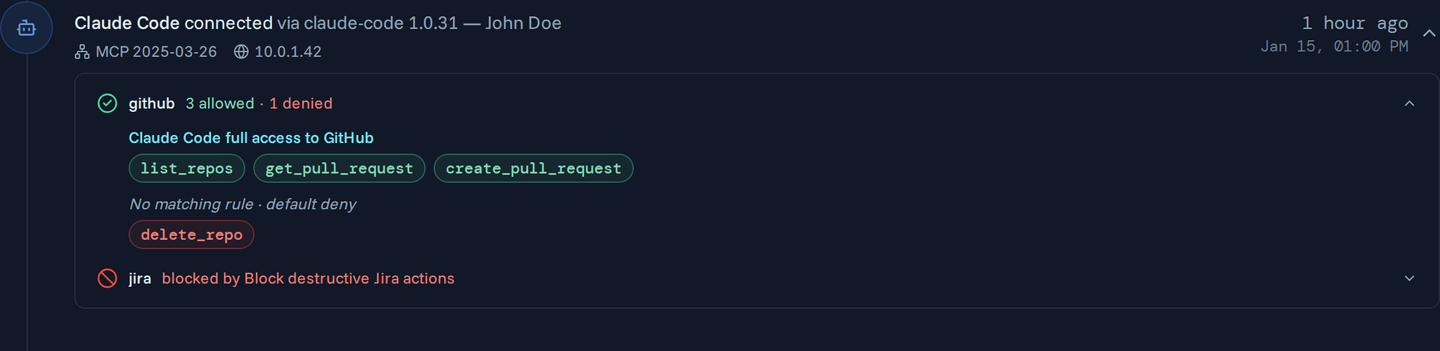
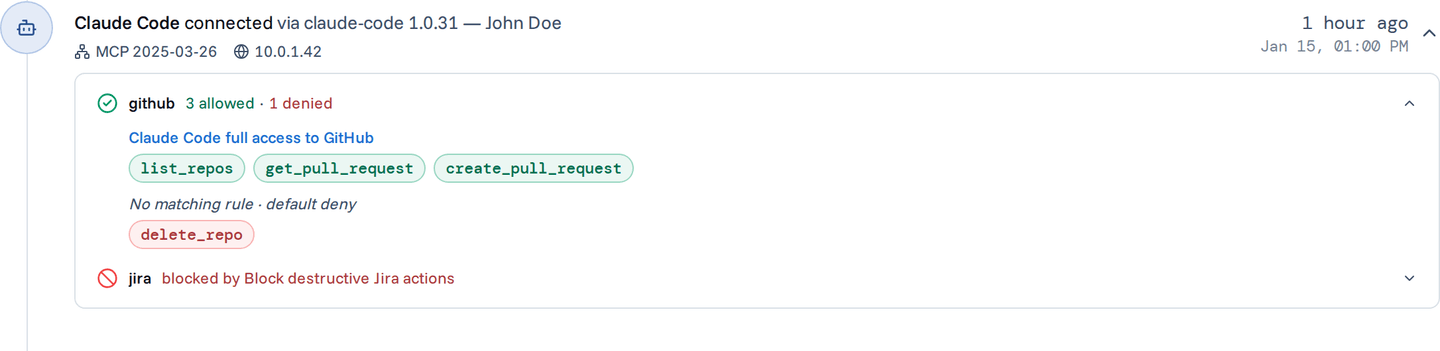
Tool executions show metadata like IP address and user agent.
A tool call whose response was redacted carries a Redacted ×N badge, where N is the total number of spans replaced. Focus or hover it to see the per-rule breakdown. The audit record stores rule names and match counts only, never the redacted text. Expanding the entry shows the same detail inline. It also names the rule that allowed or blocked the call, when one matched. Both names link to the rule that fired. A redaction rule name opens it in Data Protection. The deciding rule name opens it in Access Policies.
End users see a narrower version of this feed. Their Activity page is restricted to their own events and to an allowlist of actions: their tool calls, agent lifecycle events, and connections. Detail payloads are stripped, so they see which tools an agent could use but never which rule decided it. On an agent connection event, blocked servers and denied tools appear only in the full audit log. Tool rows stay single-line, and the redaction badge reads a generic Content redacted without naming the rules or counts. Administrative changes, and anyone else's activity, are visible only in the full audit log.
Filtering
Use the filter dropdowns at the top of the audit log to narrow the feed:
- Action – filter by event type. The dropdown lists friendly names rather than the wire values used elsewhere on this page:
gateway.tool.executedappears as Tool Executed,policy.createdas Policy Set - Agent instance – see activity for a specific connected client
- Agent – roll up across every instance of one agent (for example, all Claude Code clients)
- User – events attributed to a specific gateway user
- Group – events from the current members of a user group
- MCP – see events related to a specific MCP server
- Agent tag – events from any agent carrying a tag (for example, all
prodagents) - Resource tag – events on any MCP server or tool carrying a tag
Pagination
The audit log loads events in reverse chronological order. Scroll down and click Load more to fetch older events. The log scales to large feeds without slowdown.
Use cases
- Debug a denied request. Filter by agent and look for
gateway.tool.errorevents witherror_type: blocked_by_policy. Each blocked event references the policy that caused the block (id, name, description), so you can identify the responsible policy even if it has since been modified or renamed. - Review agent onboarding. Filter by
agent.connectedto see when agents connect (the earliest event marks the first connection), which tools they were granted, and which rule granted or blocked each one. The API reference documents the event payload. - Audit policy changes. Filter by
policy.created,policy.updated, orpolicy.deletedto track who changed access rules and when. - Prove a response filter is working. Look for the Redacted ×N badge on
gateway.tool.executedevents; the per-rule breakdown names each filter and the spans it replaced, so you can confirm sensitive data never left the gateway. - Monitor a specific resource. Filter by MCP server to see all tool calls made to that service across all agents.
Next steps
- Analytics – aggregated trends instead of a raw event feed.
- Policies – the rules behind every allow and deny you see logged here.
- Connections – where connection-created and revoked events come from.