MCP security analytics
See which tool calls your policies blocked, for which agents and users, and which policies do the most blocking
One blocked call is a policy working; a wave of them is an agent misbehaving or a rule that's too tight. The Security tab of Activity › Enforcement Traffic shows blocked tool calls as trends, so you can tell which.
What the tab shows
The Security tab surfaces tool calls that were blocked by policy, useful for investigating which agents are hitting policy boundaries and which policies are doing the most enforcement.
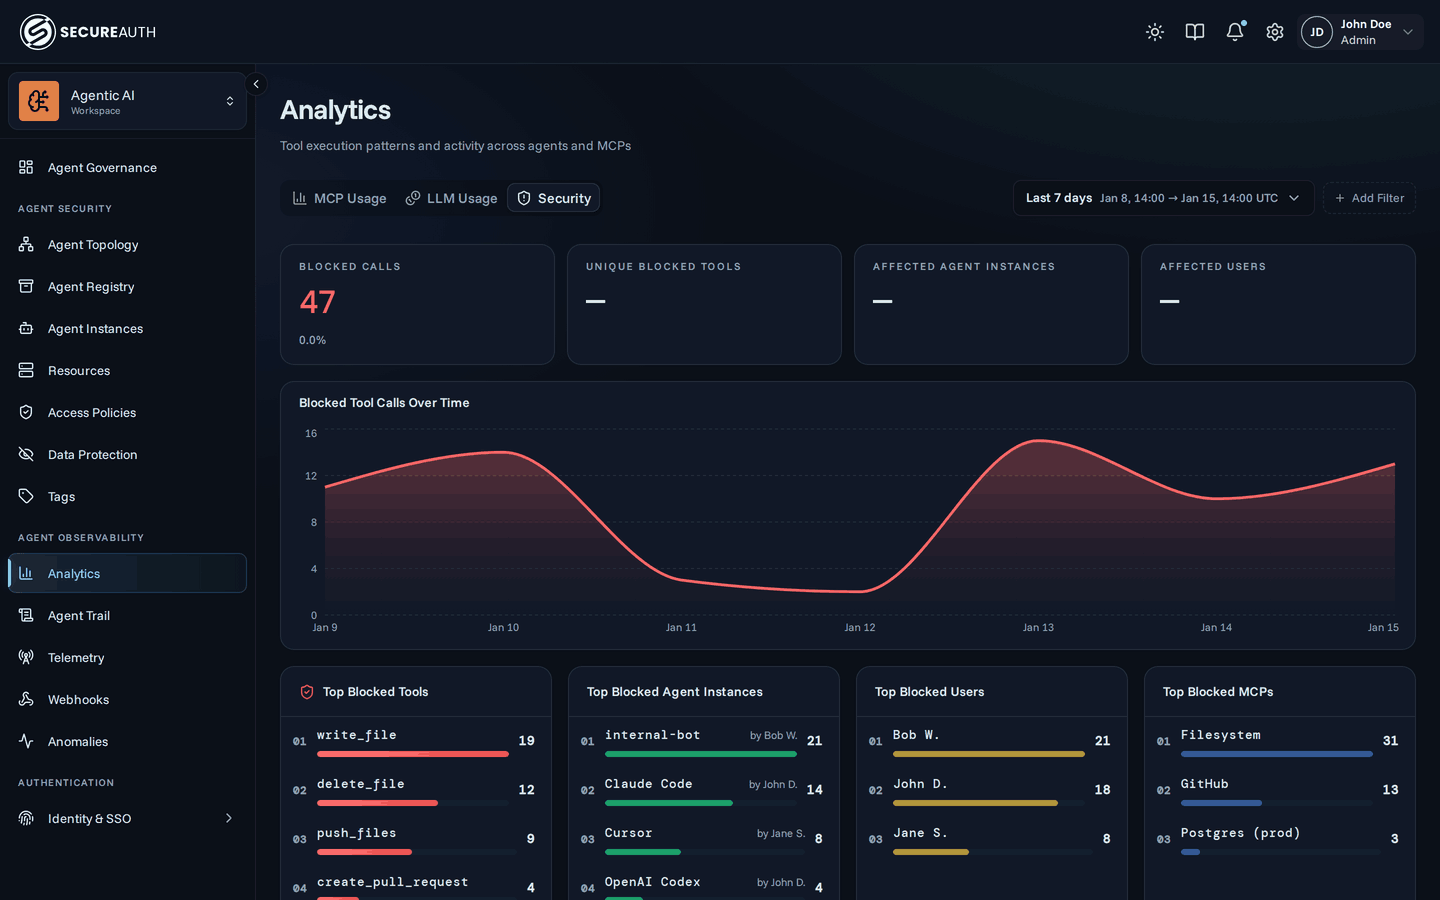
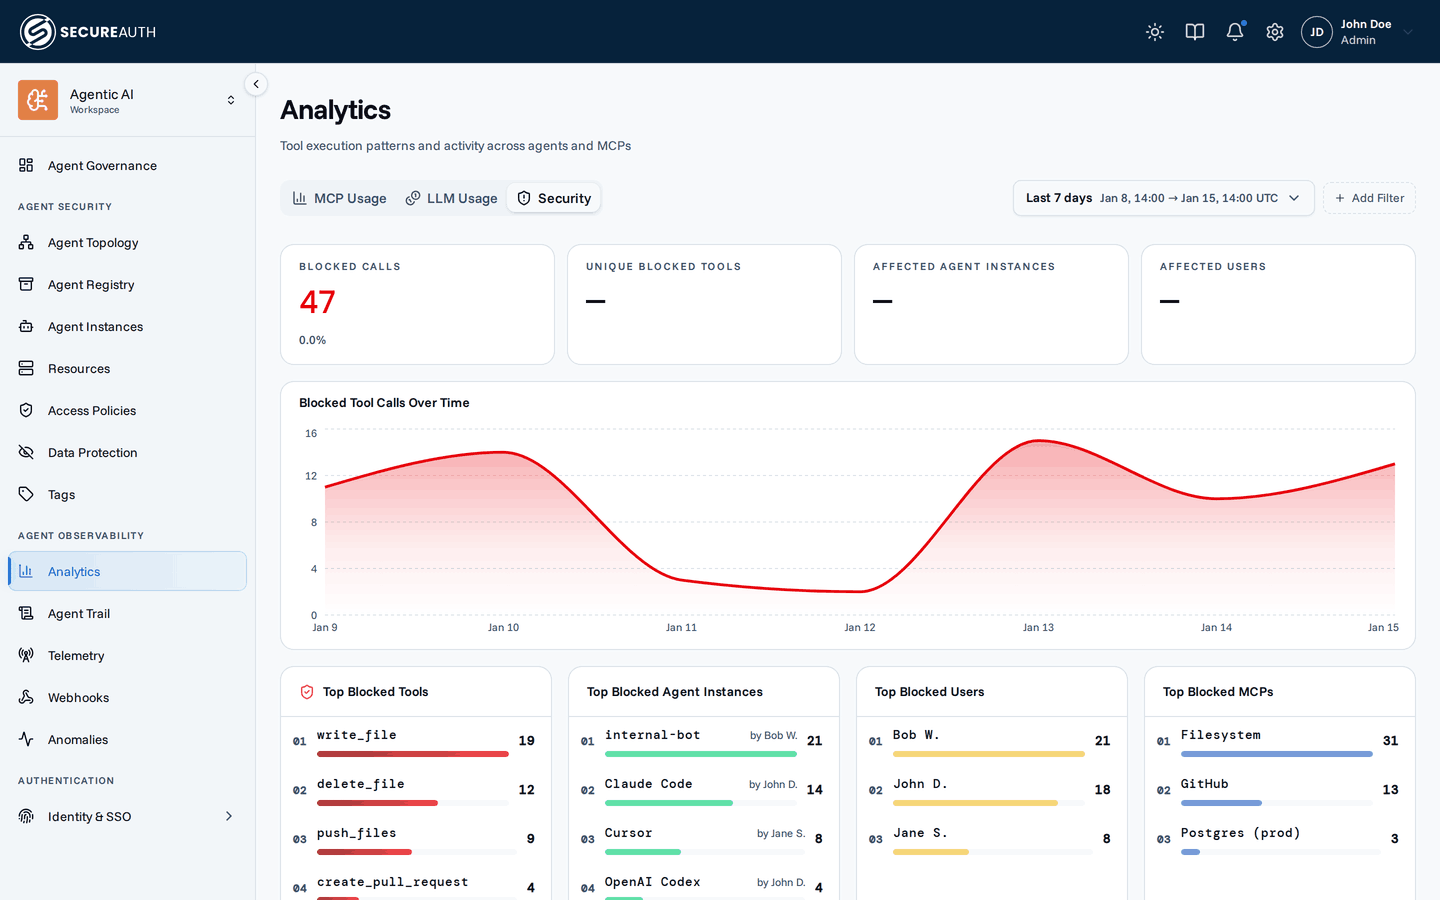
- Blocked calls, unique blocked tools, affected agent instances, affected users – headline counts for the selected period: how many calls were stopped, how many distinct tools they hit, and how much of your fleet ran into a policy wall
- Blocked tool calls over time – line chart showing when blocks happen
- Top blocked tools / agent instances / users / MCPs – what's hitting policy walls (paginated, 10 per page)
- Top blocking policies – which policies are doing the most enforcement (paginated, 10 per page)
Each blocked tool event in the audit log references the policy that caused the block (id, name, description), so you can identify the responsible policy even if it has since been modified or renamed.
Filters
The Security tab uses the same filters as the MCP Usage tab: date range, User, Group, agent-instance, agent, MCP, and tag. See Filters.
Next steps
You can now see which calls your policies blocked and which rules did the blocking. Next, open the events behind a spike to see each blocked call.
- Audit log – each blocked call, with the policy that blocked it.
- Agent Access – adjust the rule that's blocking more than it should.