Cost
What your organization pays for LLM usage, what that usage would cost at API list price, and how seat pricing turns telemetry into real spend
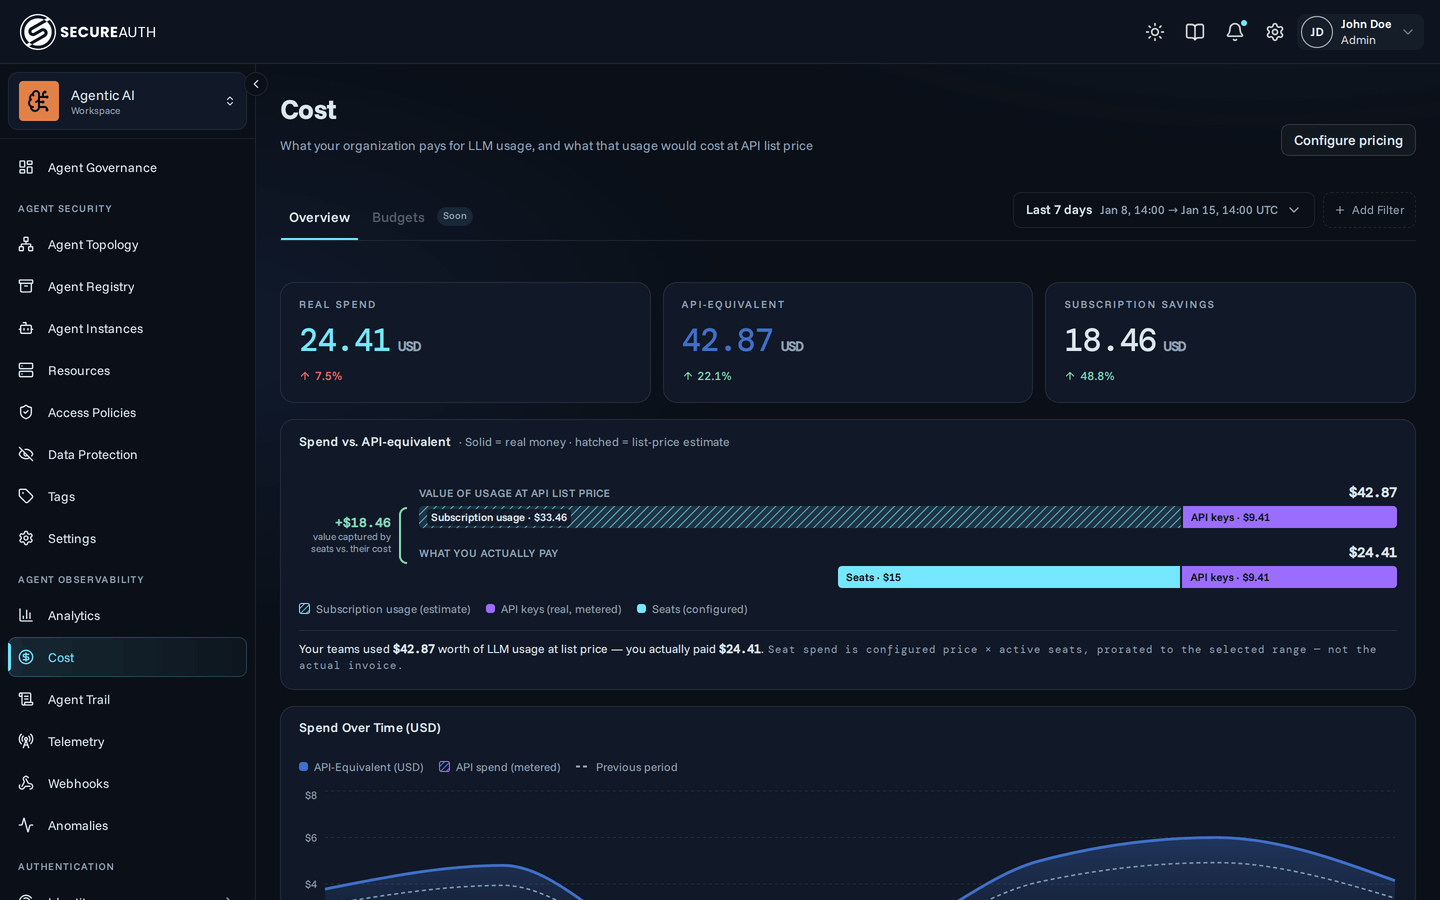
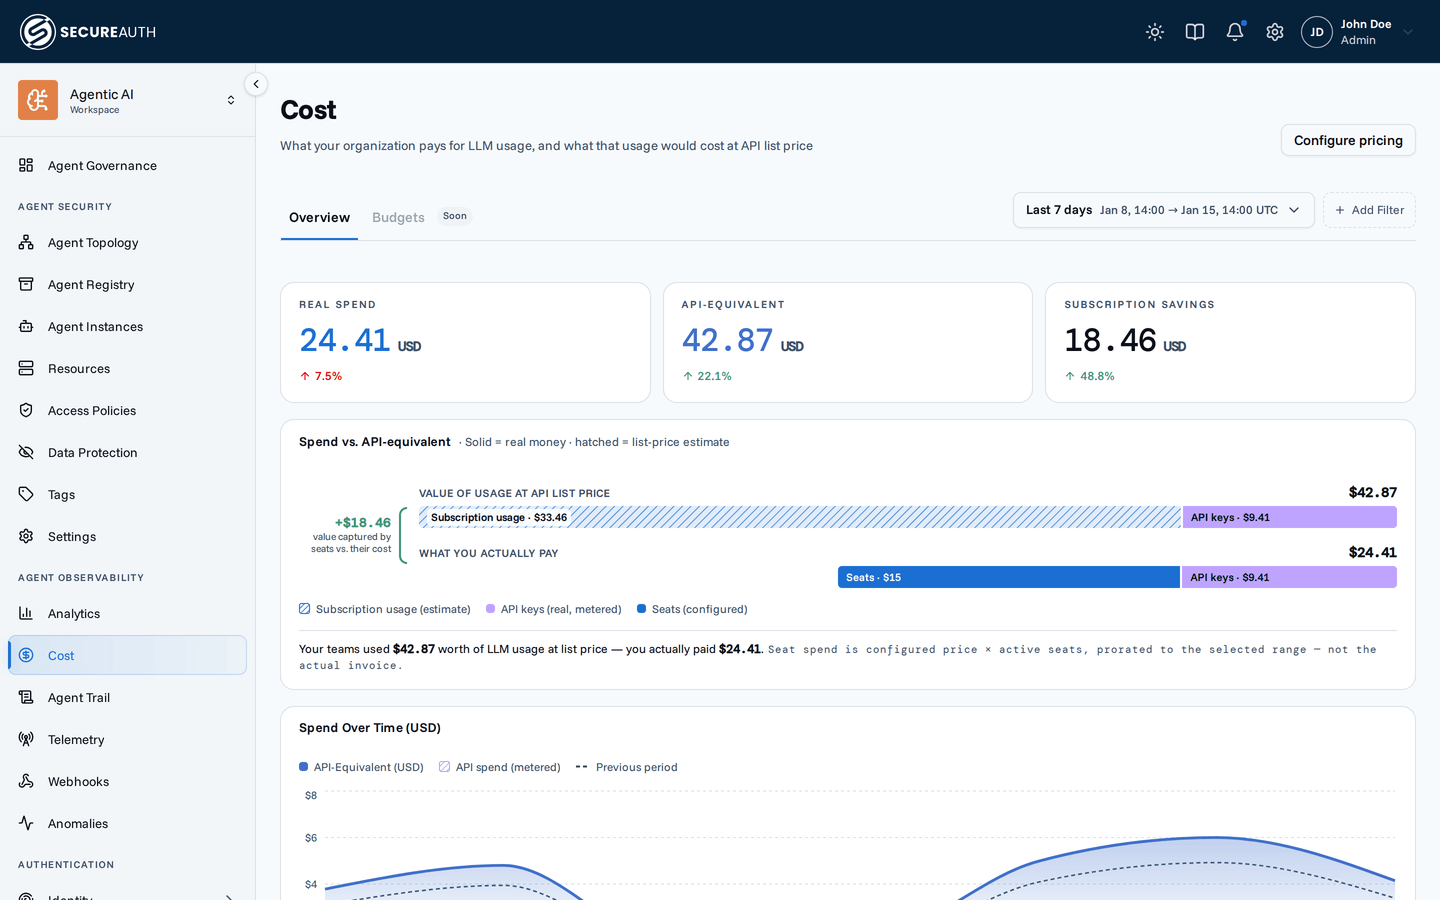
Navigate to Cost & Adoption (under Activity in the sidebar) to see every dollar-denominated measure in one place: what you actually pay, what your usage would cost at API list price, and what the subscription is saving you. The token and session dashboards on the Analytics page carry no dollar figures — cost analysis lives here.
The page shares the Analytics filter set for LLM data — Provider, Model, Auth mode, User, and Group — plus the standard date-range picker. Note the split: Model and Auth mode scope only the Spend Over Time chart and the top tables; the headline measures and the Spend vs. API-equivalent panel take only Provider, User, and Group (a model can't scope a seat, and the panel decomposes by auth path itself). Cost by team and Model mix by team are always org-wide: they ignore User — filter to one person and each section says so, and the reclaim strip steps aside since the rows no longer decompose the filtered page's Real Spend. A single person's cost lives on their profile's Cost tab. A Budgets tab is visible but disabled: budget management is on the roadmap, and this page is the surface it will land on.
The measures
Three headline figures, with previous-period deltas:
- Real Spend (USD) — metered API-key spend plus configured subscription seat cost. Real money, to the extent seat prices are configured.
- API-Equivalent (USD) — the list-price value of all usage: "what this would have cost if every request had been billed per token on the API." An estimate, never presented as money spent.
- Subscription Savings (USD) — the API-equivalent value of subscription usage minus what the seats cost. Can be negative: if a subscription's usage would have cost less on the API than the seat costs, savings goes negative rather than flooring at zero.
Spend vs. API-equivalent
The centerpiece figure composes those numbers into one picture: two horizontal bars on a shared scale — the top bar is the list-price value of all usage (a hatched subscription-usage estimate plus solid, metered API-key spend), the bottom bar is what you actually pay (the same API-key dollars plus your configured seat cost) — with a bracket naming the difference as savings. Solid fill means real money; hatching means a list-price estimate. The figures it draws from:
- API Spend (USD) — the API-equivalent value of usage where
auth_mode = api. This is real metered money, since API-key usage is billed per token. - Subscription Spend (USD) — configured seat price × active subscription seats, summed per calendar month. This is configured, not invoiced: it reflects what you told the gateway a seat costs, so it's an approximation of the real invoice — it counts calendar months rather than your billing anniversary, and it only counts seats with usage that month (an assigned-but-idle seat isn't counted). It's closer to real money than API-Equivalent, but it is never presented as the actual bill.
Until seat prices are configured, the bottom bar shows only API-key spend and a hint, where the seats segment would be, linking to the Subscription pricing page.
The auth-mode classification behind the split — how a session authenticated, and why it's a proxy for billing rather than billing truth — is described in the Analytics guide.
Spend over time
A line chart of the API-equivalent value per day (or hour, for short ranges), with a hatched API spend overlay so you can read the real metered share against the estimated whole, and a dashed previous-period comparison.
On a day when a model's list price changes, the daily point values that whole day at the price in effect at the day's start, so it can differ slightly from adding up the same day's hourly points (which each use the price in effect that hour). The difference only appears on a rate-change day, and only for the token-derived providers (Codex, Copilot, and Gemini CLI).
Cost by team
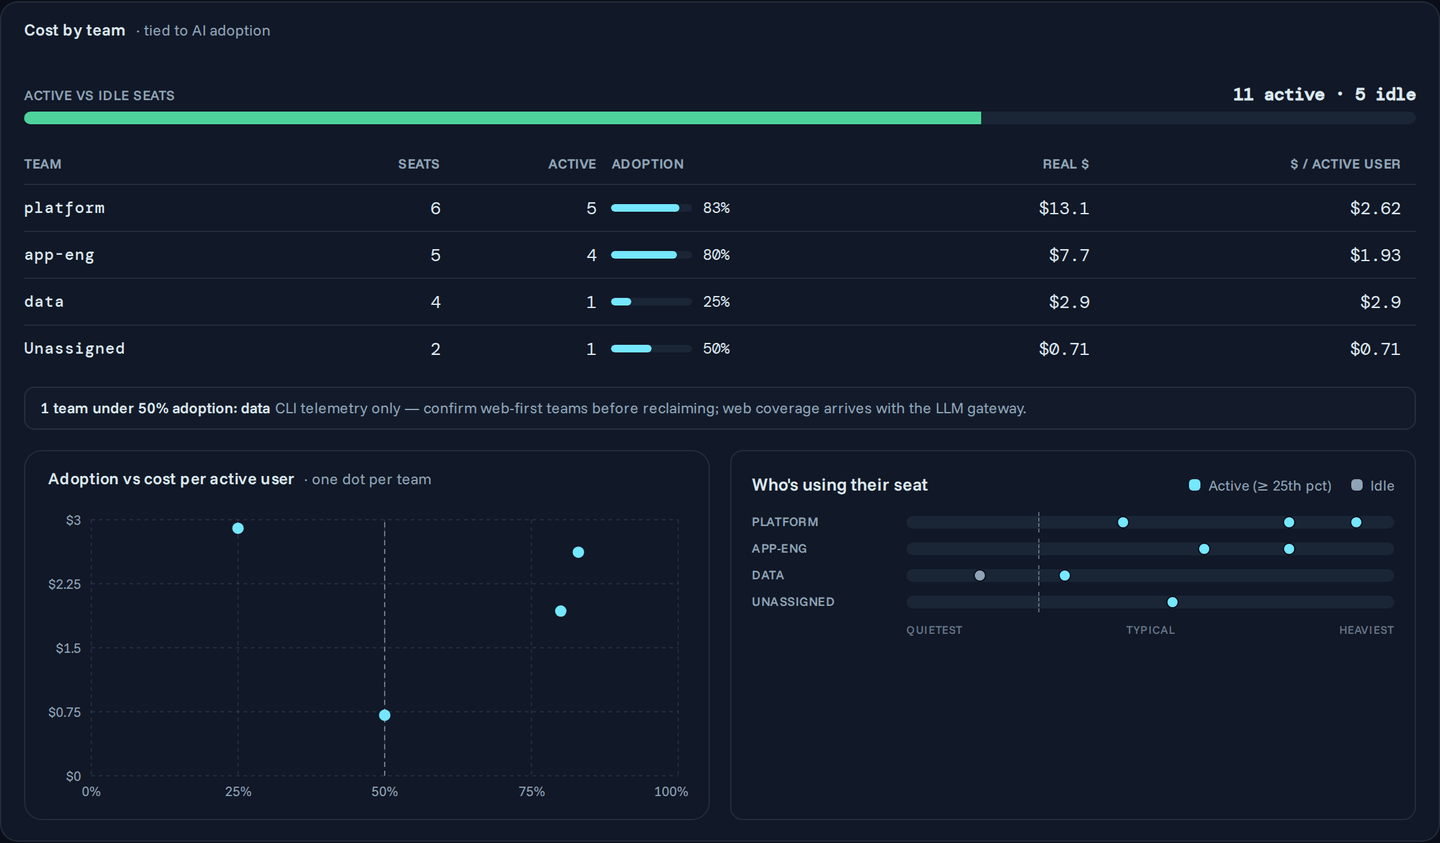
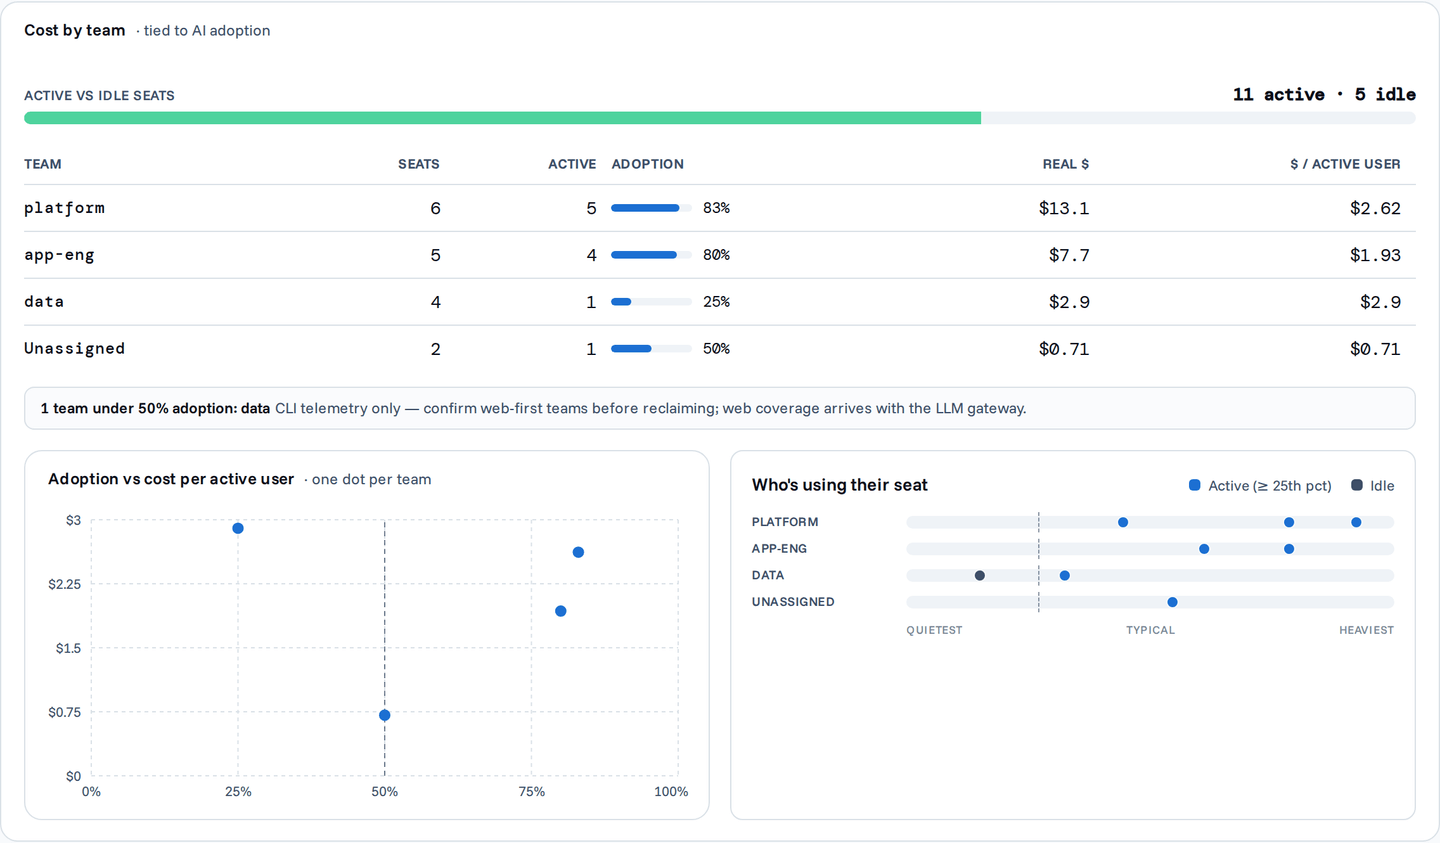
Below Spend over time, the page breaks the same money down by IAM group, tied to whether the seats are actually used. A split gauge shows active vs. idle seats org-wide, and the team table carries each group's seats, adoption, Real $ (the group's even-split share of metered API spend plus configured seat cost — the same definition as the page's Real Spend tile), and $ per active user. Users who belong to several groups have their money split evenly across them, so team rows always add up to the org totals; users with no group land in an explicit Unassigned row. Filter to a group and the split narrows with it: that group is charged its members' whole cost, the rows still add up to the filtered totals, and no unselected team turns up carrying half of a shared member.
"Active" means the seat is genuinely in use, on a forgiving bar: a user counts as active when their total token usage over the selected range puts them at or above the twenty-fifth percentile of users with usage in that range. It only flags truly idle seats — someone using Claude Code lightly still counts as active. A summary strip below the table names each IAM group under 50% adoption as a reclaim candidate — a prompt to go ask the team, never an automatic action. The Unassigned row is never named there: it also absorbs usage that matched no gateway user, so its adoption isn't a team's to answer for.
Mind the blind spot before reclaiming: that strip's numbers come from CLI telemetry only. A team that works web-first can look idle here while using their seats heavily — confirm with the team before reclaiming anything. Web coverage arrives with the LLM gateway.
Below the table, a scatter plots each team's adoption against its cost per active user (expensive-and-idle teams stand out in the top-left), and per-team percentile strips show every member as a dot on the org-wide usage scale, with the twenty-fifth-percentile "active" bar marked. Past 500 users the strips plot the heaviest 500 and say so in their heading — the percentiles themselves, and every number in the table above, are always computed over the whole population.
Model mix by team
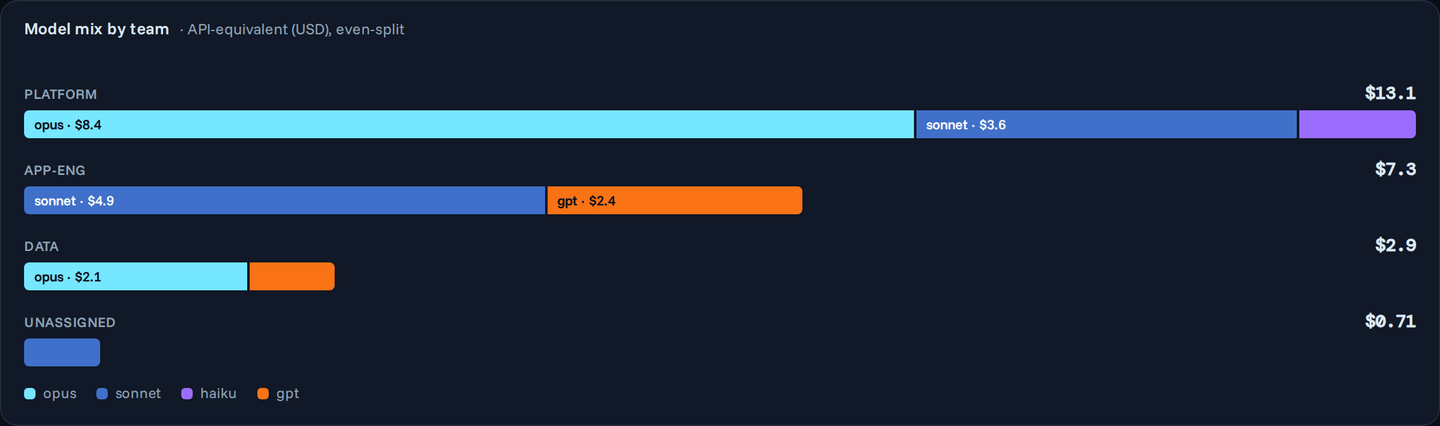
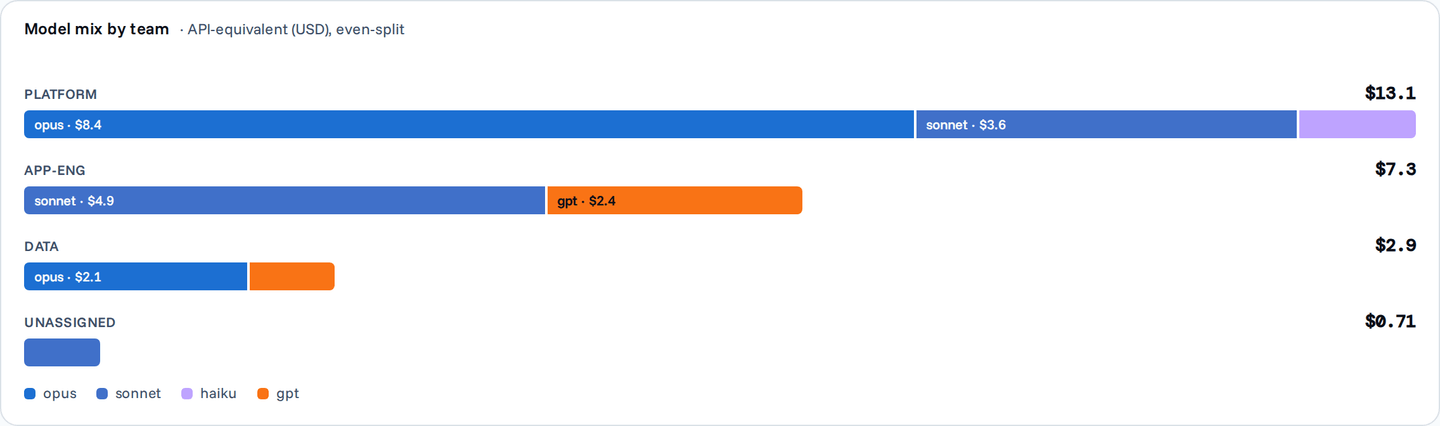
One bar per group, segmented by model family (Opus, Sonnet, Haiku, Fable, other), on a shared dollar scale. It's descriptive — which teams lean on which models — not a recommendation to switch anyone down. Full model names are folded to families for display only; the underlying data keeps exact model names.
Token economics
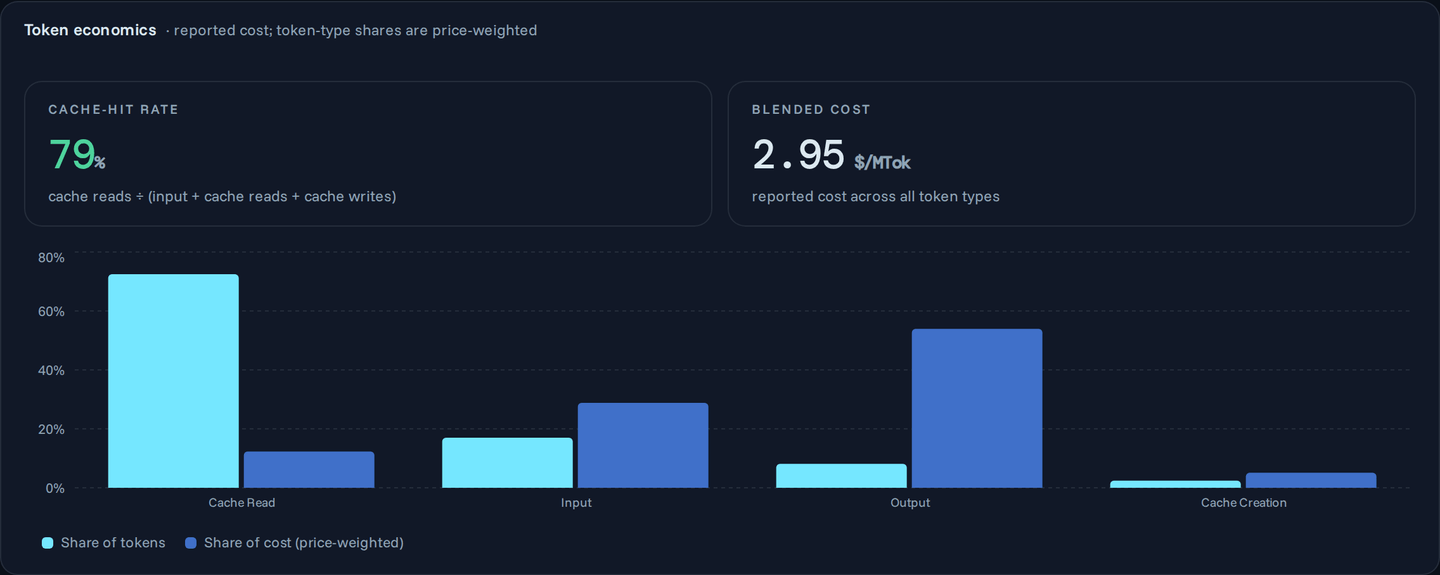
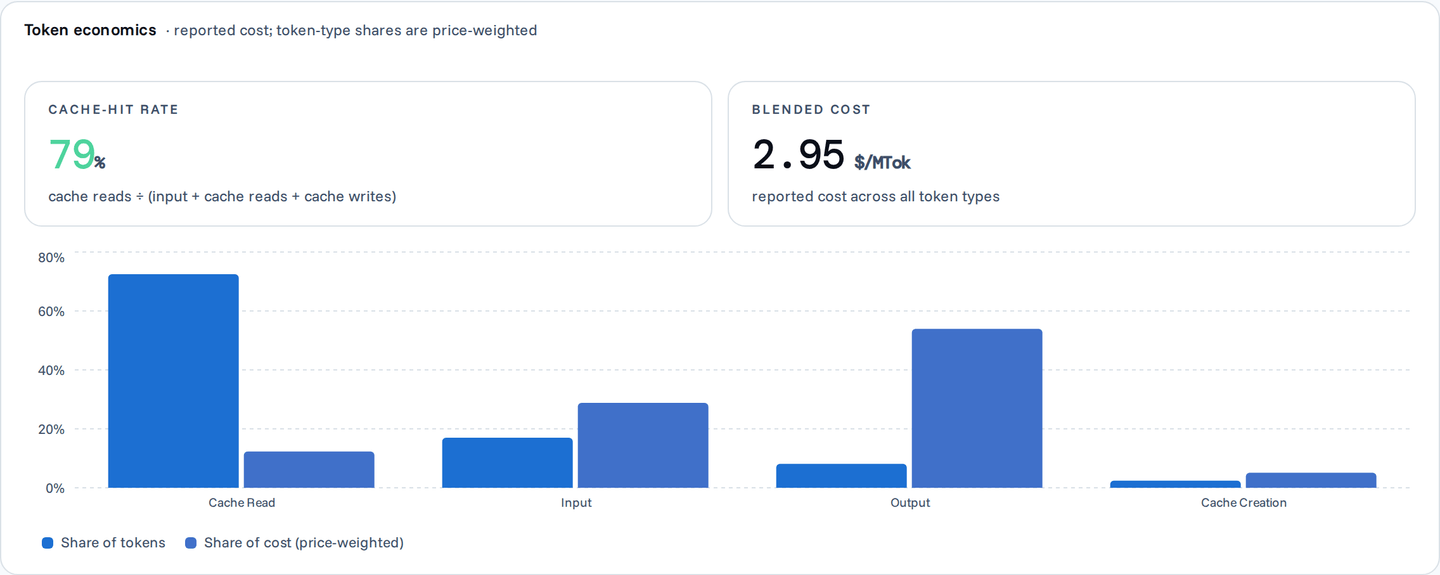
Two stats summarize how efficiently tokens turn into work: the cache-hit rate (cache reads as a share of all prompt-side tokens — high is good, it means repeated context is served from cache at a fraction of the price) and the blended $/MTok (reported cost per million tokens across all token types). For the people driving that cost, read Top users below — it ranks on the same reported figure, so it holds for every provider whether or not its models carry a configured list price.
Splitting cost by token type is the one thing reported cost can't do — providers report a single figure per request — so the paired-bar chart contrasting each token type's share of volume against its share of cost is price-weighted from the gateway's model price list. Tokens on models with no configured price keep their volume and contribute no cost, so the chart is captioned with the share of tokens its cost side actually covers.
Top users and models
At the foot of the page, Top Users by API-Equivalent (USD) and Top Models by API-Equivalent (USD) rank who and what racks up the most list-price value, ten per page. Both read the API-equivalent estimate rather than Real Spend, so they tell you where the usage is concentrated rather than who spent the money. A user's bar links to that person's profile Cost tab, where the same usage is broken out for them alone.
Unlike Cost by team and Model mix by team, these two honour every filter on the page, Model and Auth mode included — so filtering to auth_mode = api turns Top Users into a ranking of metered spend, and picking one model narrows both tables to it.
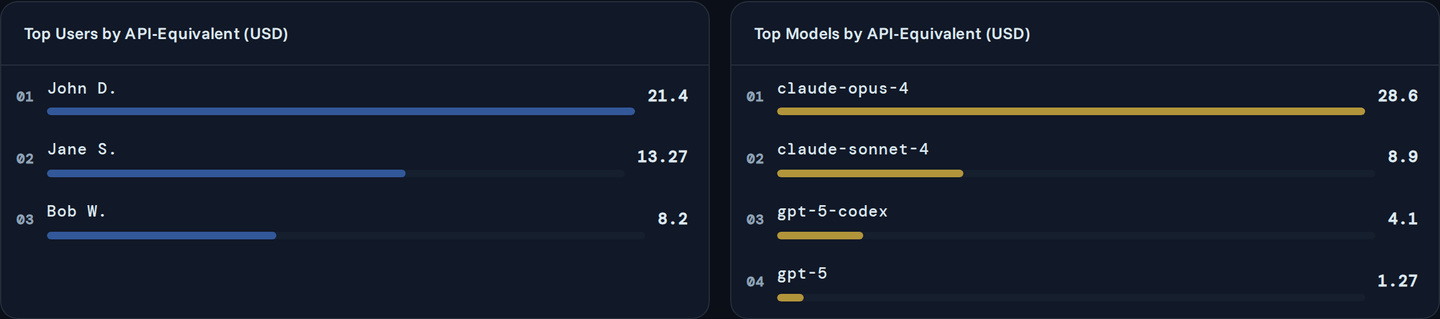
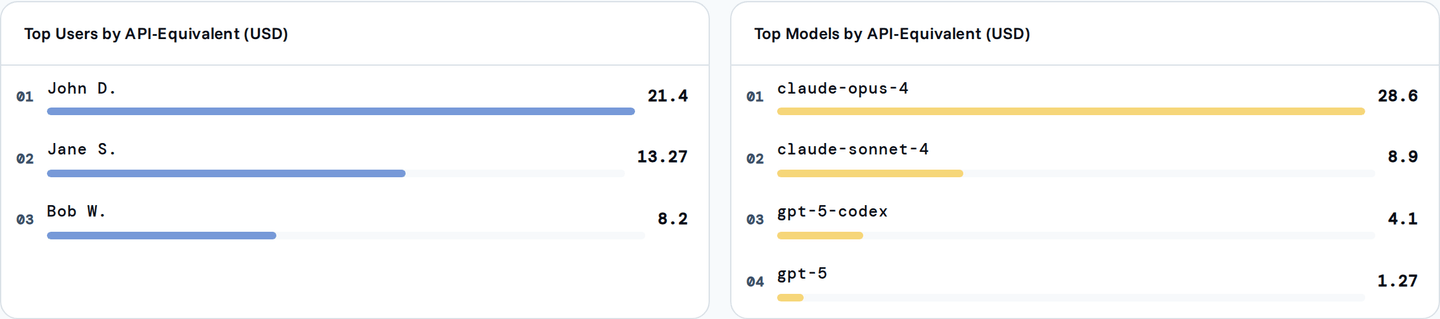
Per-user API Spend for Claude is structurally unattributed. Claude's auth-mode inference is the presence of account identity — so by construction, Claude rows classified as api carry no account identity to attribute to a person. Claude API Spend can be totalled per org or model, but never broken down per user: expect an unattributed row. Codex API-key usage keeps per-user attribution when the client stamps a user email.
Subscription pricing
Admins with the manage_seat_pricing permission configure subscription seat costs on the Subscription pricing page under Settings (/settings/subscription-pricing, linked from this page's Configure pricing button): a Plan prices table sets the monthly rate for a provider/plan combination, and a Who's on which plan table says who's assigned — a blank user sets the org default that every subscription user inherits, and a specific user overrides it. Both are effective-dated: a change applies from its effective date, and each month is priced at the rate that was effective at the time — so setting a past effective date recomputes those months' Subscription Spend.
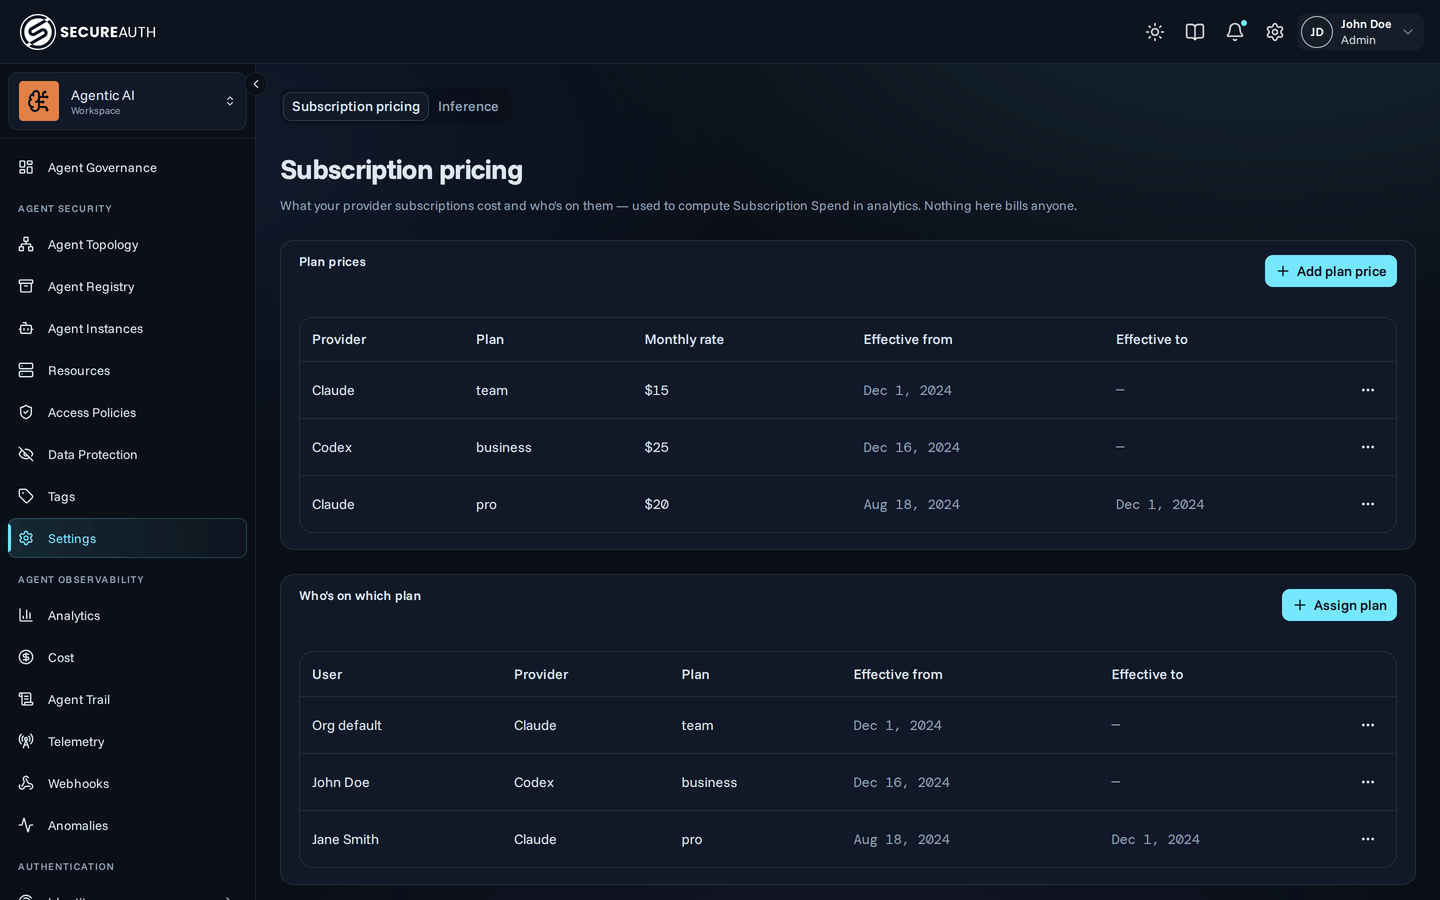
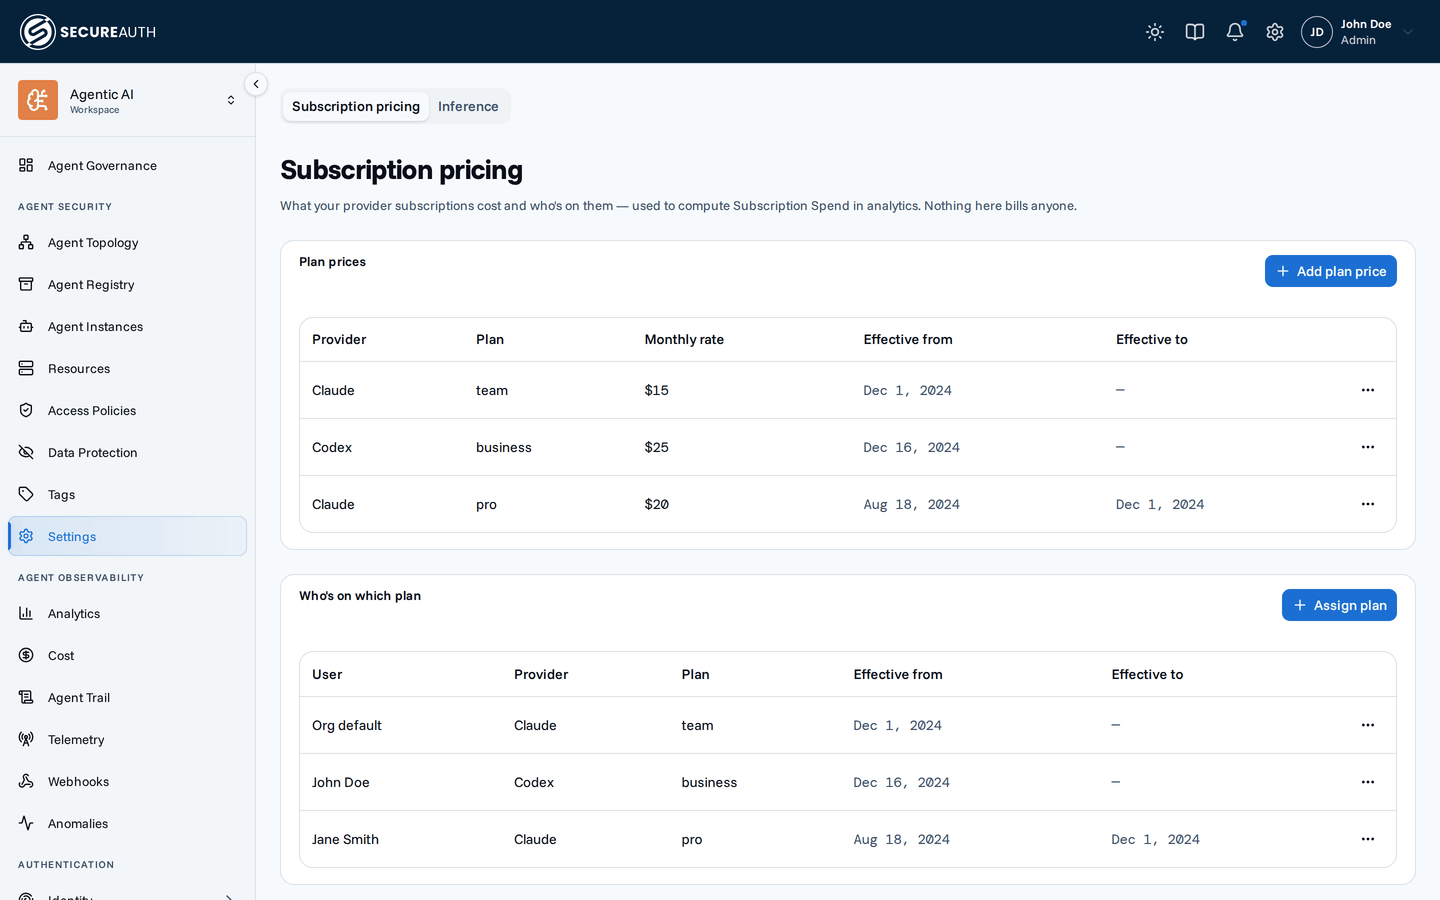
Each row can be ended or deleted, and the distinction matters. Ending a price or assignment closes it as of now — it stops applying to future months, but history and every month it already priced keep it. Deleting removes the row as if it were never configured, so any months it had priced become unpriced and Subscription Spend recomputes for them. Reach for End when a plan or assignment is genuinely over; reach for Delete only to undo a row entered by mistake.
Cancelling a scheduled row — one whose effective date hasn't arrived — reverts the change: the price or assignment it superseded resumes for the months the cancelled row would have covered. (If nothing preceded it — a first-ever row, or one whose predecessor was already ended — those months simply stay unpriced.)
Every edit here lands in the audit log: who set a rate, who moved someone between plans, and — because a rate change writes a new effective-dated row rather than editing one — the rate it replaced.
Who sees which figures
This page is the org-wide view, and it lives here in the admin console. The user portal shows a person only their own usage:
- Their own spend, on their own dashboard. The portal's landing page carries a Cost measure and a spend-over-time chart covering only that person's usage. One person's seat cost is the same for everyone on their plan, so the card shows the API-equivalent estimate that tracks their usage, whether or not seat pricing is configured. Until their agent reports usage there is no zero; the card invites them to connect one via the portal's Quickstart page (walkthrough).
- Nothing about anyone else. The portal narrows every figure to the person signed in, and asking it for someone else's usage returns their own. It carries no team breakdowns: Cost by team, Model mix by team, and the percentile strips are org-wide views, and this page is where they live.
To investigate one person, use that person's profile Cost tab here in the console, which carries the full breakdown.