Monitor activity
See what your agents are doing in real time
Once agents are connected and making tool calls, you can monitor everything from the dashboard.
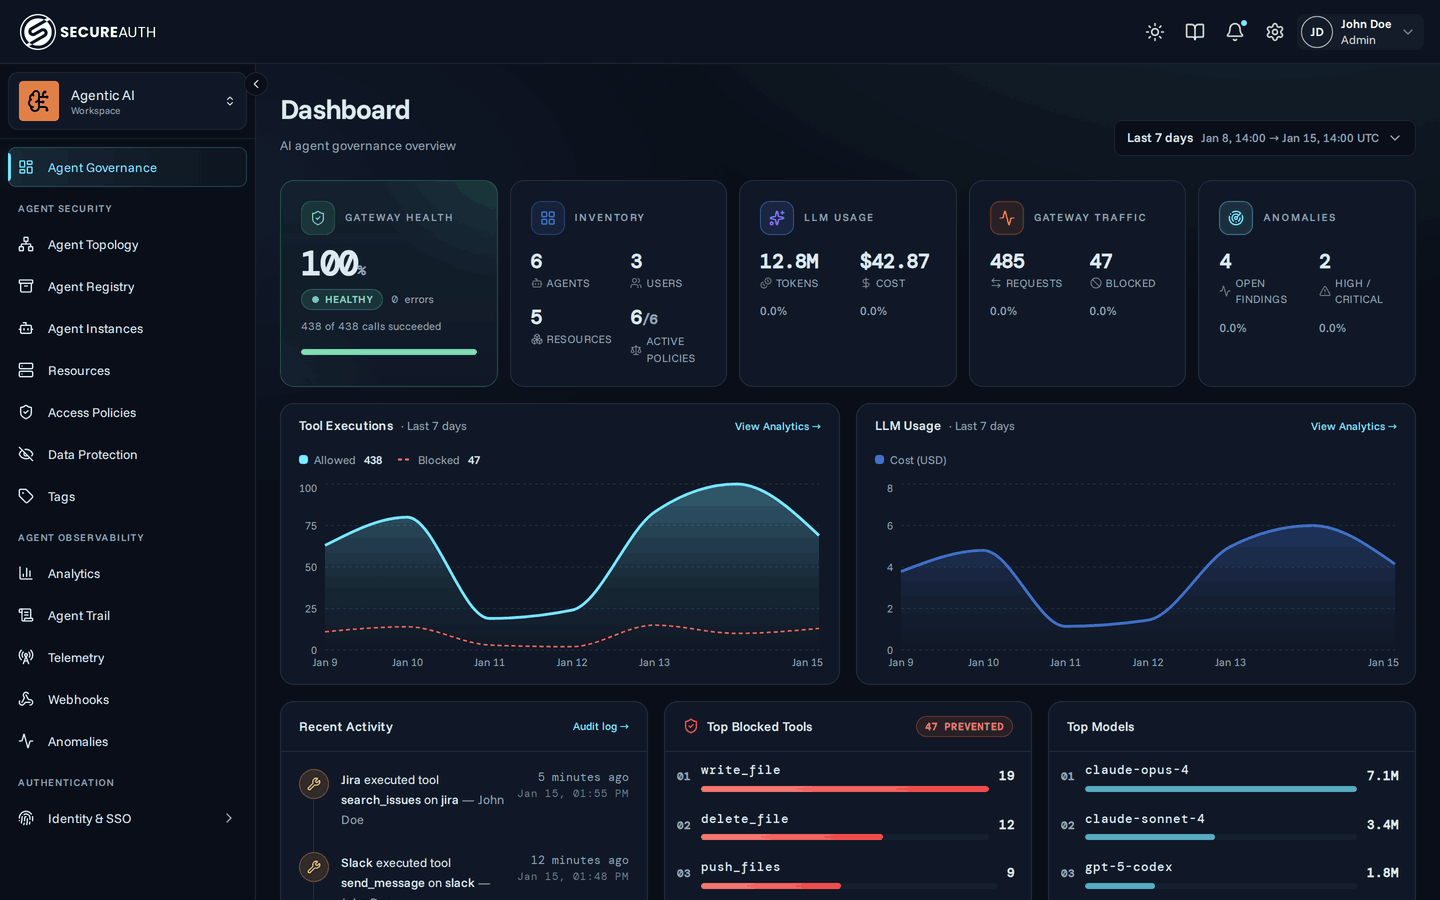
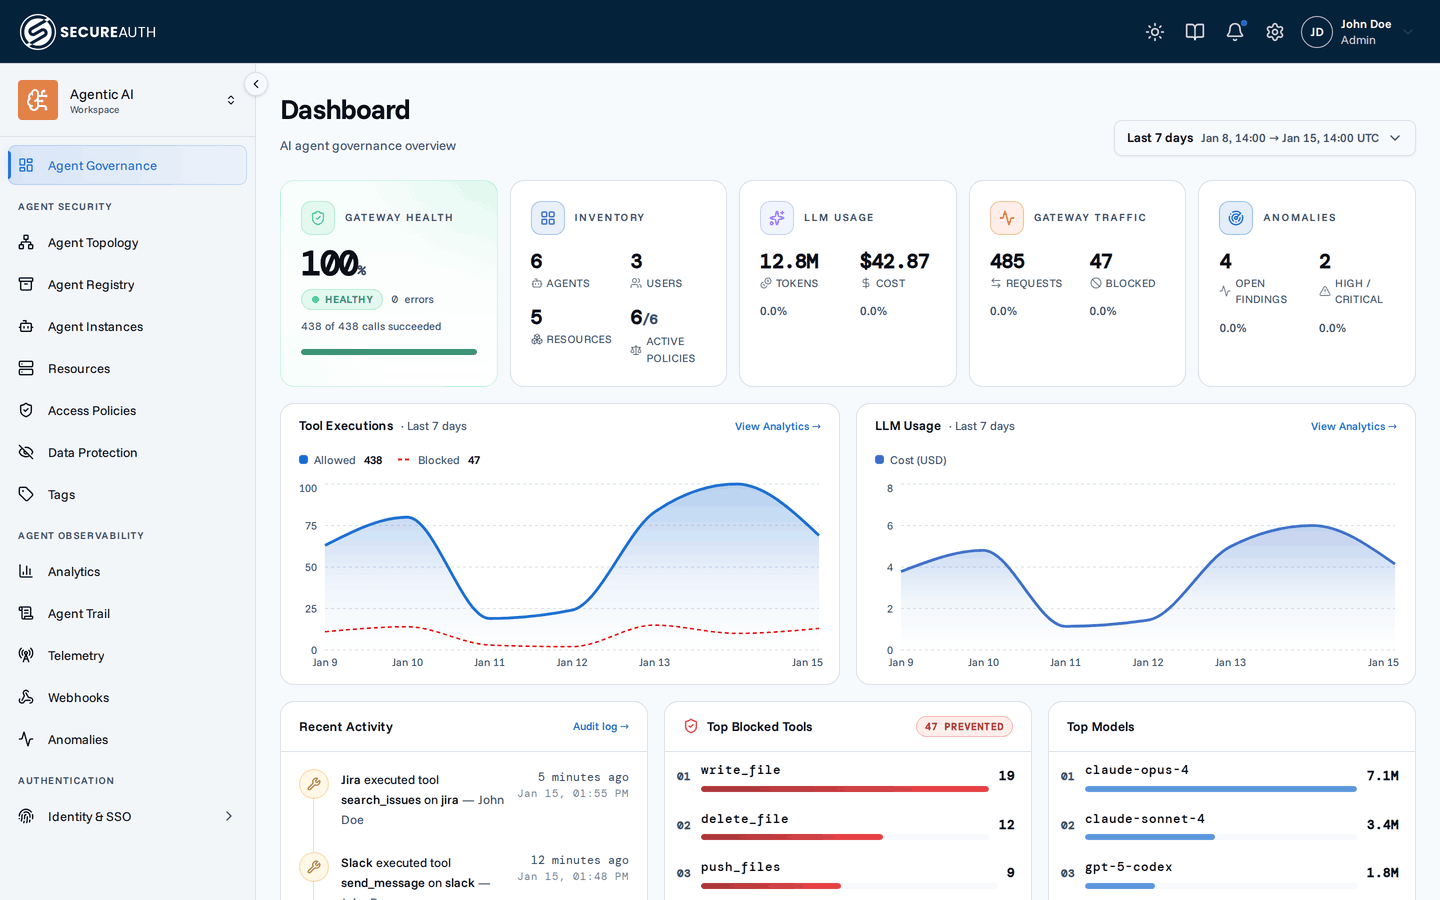
Dashboard
The dashboard groups key metrics into themed cards:
- Gateway health — the share of tool calls that executed successfully, with a count of real errors (timeouts, upstream failures; policy blocks excluded)
- Inventory — counts of agents, users, resources, and policies
- LLM usage — spend and tokens across your agents
- Gateway traffic — total requests through the gateway and how many were blocked
Below the cards, a tool executions trend sits beside an LLM usage cost-over-time chart. The bottom row shows the top models by token usage, recent activity, and top blocked tools. The LLM widgets populate once agents report usage through OpenTelemetry.
Audit log
Navigate to Agent Trail (Audit log) to see a real-time feed of every action. Each entry shows the timestamp, actor (user or agent), the resource and tool involved, and the outcome.
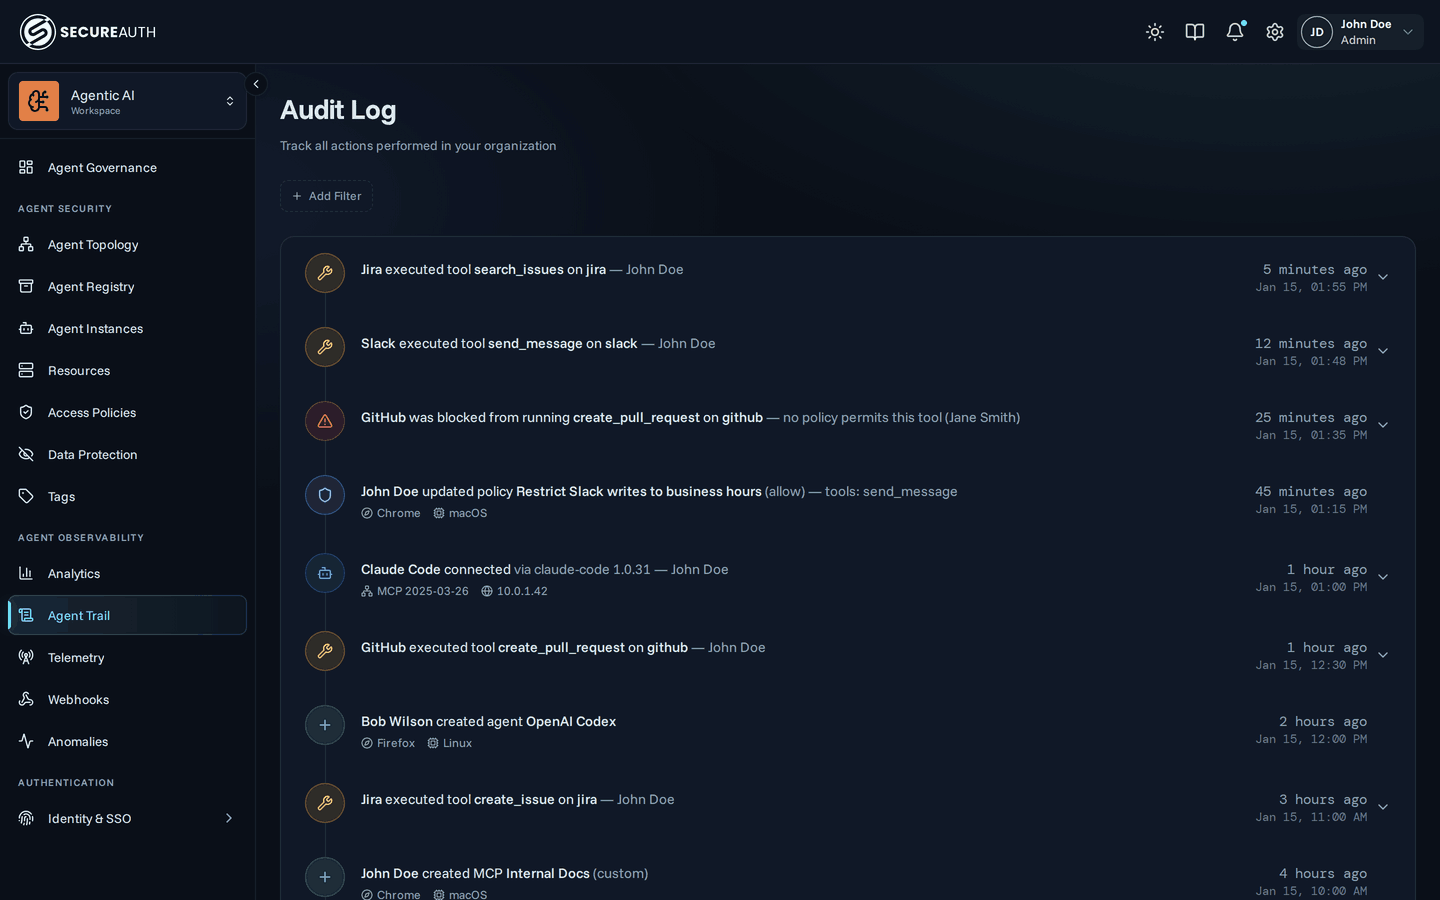
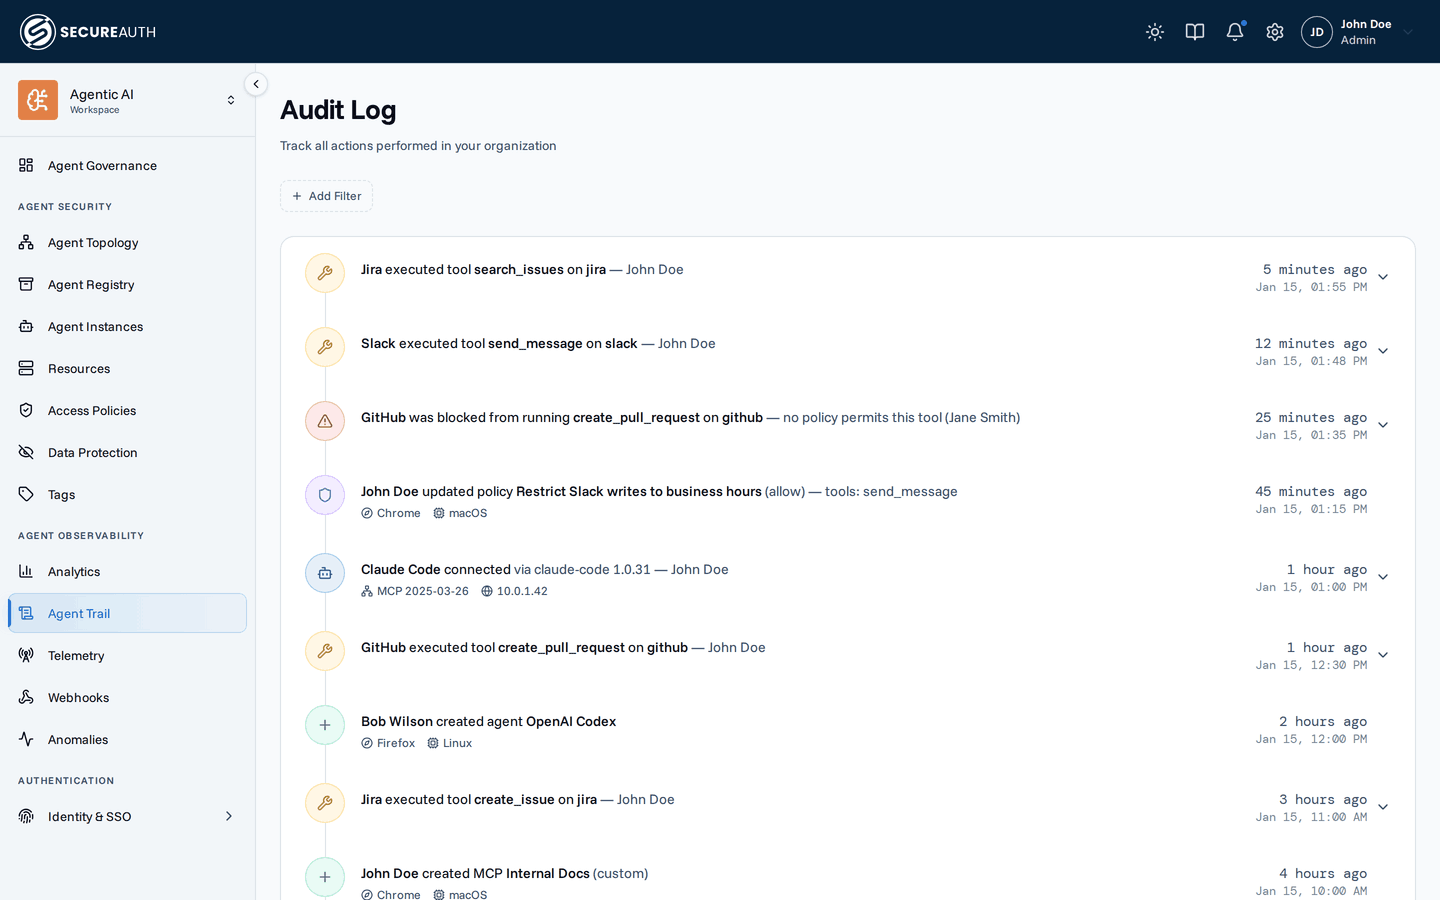
Events include tool executions, agent connections, policy changes, resource changes, and connection events. Metadata like IP address and browser appears inline on each entry. Entries that carry more detail — tool calls, agent connections, and configuration changes — expand: a tool call reveals the tool, resource, agent, policy decision and its reason, and any DLP redactions.
Use the filter bar to narrow the feed by Action, Agent Instance, Agent (for example, all Claude Code clients), MCP (the resource involved), User, Group, or tag.
Analytics
For aggregated trends over time — tool usage, LLM token spend and cost, and policy-enforcement metrics — open Analytics. It has three tabs: MCP Usage, LLM Usage, and Security.
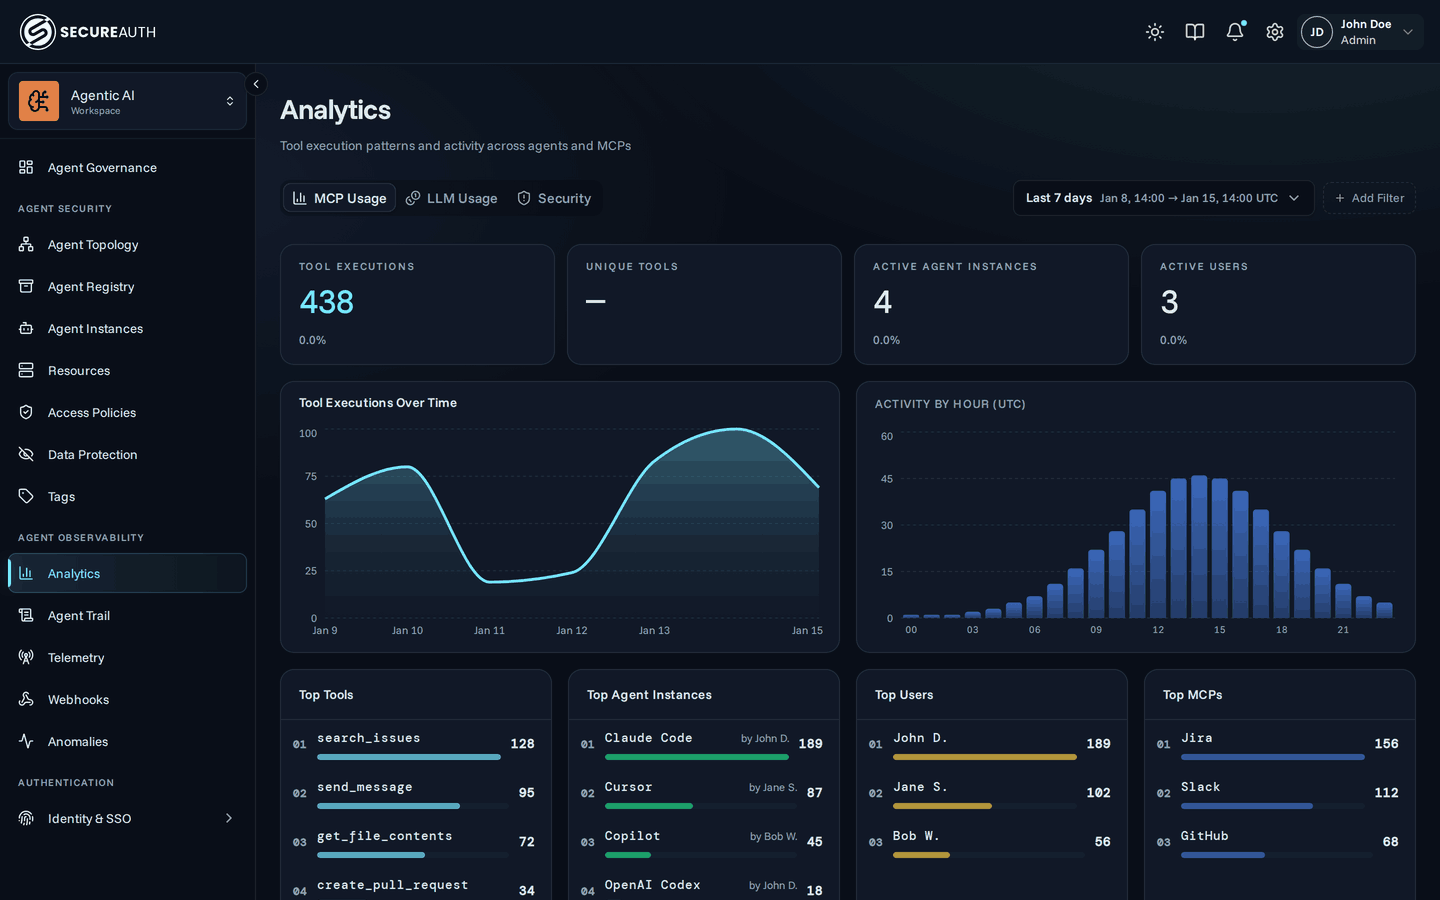
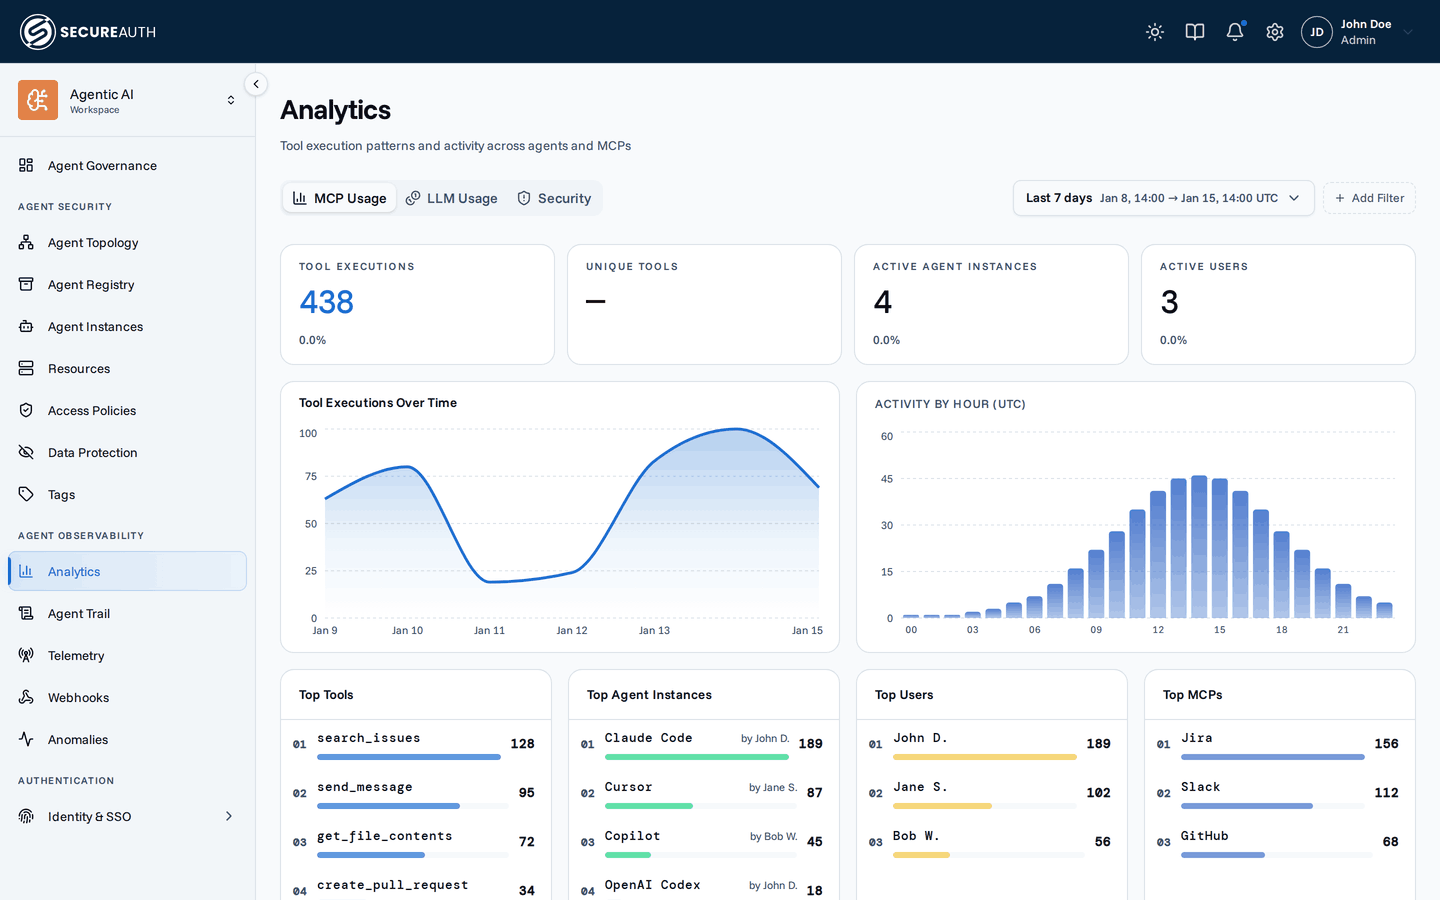
See the Analytics guide for a full breakdown of each tab, and OpenTelemetry for how to feed the LLM Usage tab with token and cost data from Claude and Codex.
Next steps
You've completed the four-step setup. For deeper detail on today's activity, see the Audit log guide for filtering and use cases, and Analytics for trends over time.