Analytics
Aggregated tool usage, LLM token spend, and policy-enforcement trends over time
Navigate to Analytics to see aggregated data over time. The page has three tabs: MCP Usage, LLM Usage, and Security.
MCP Usage
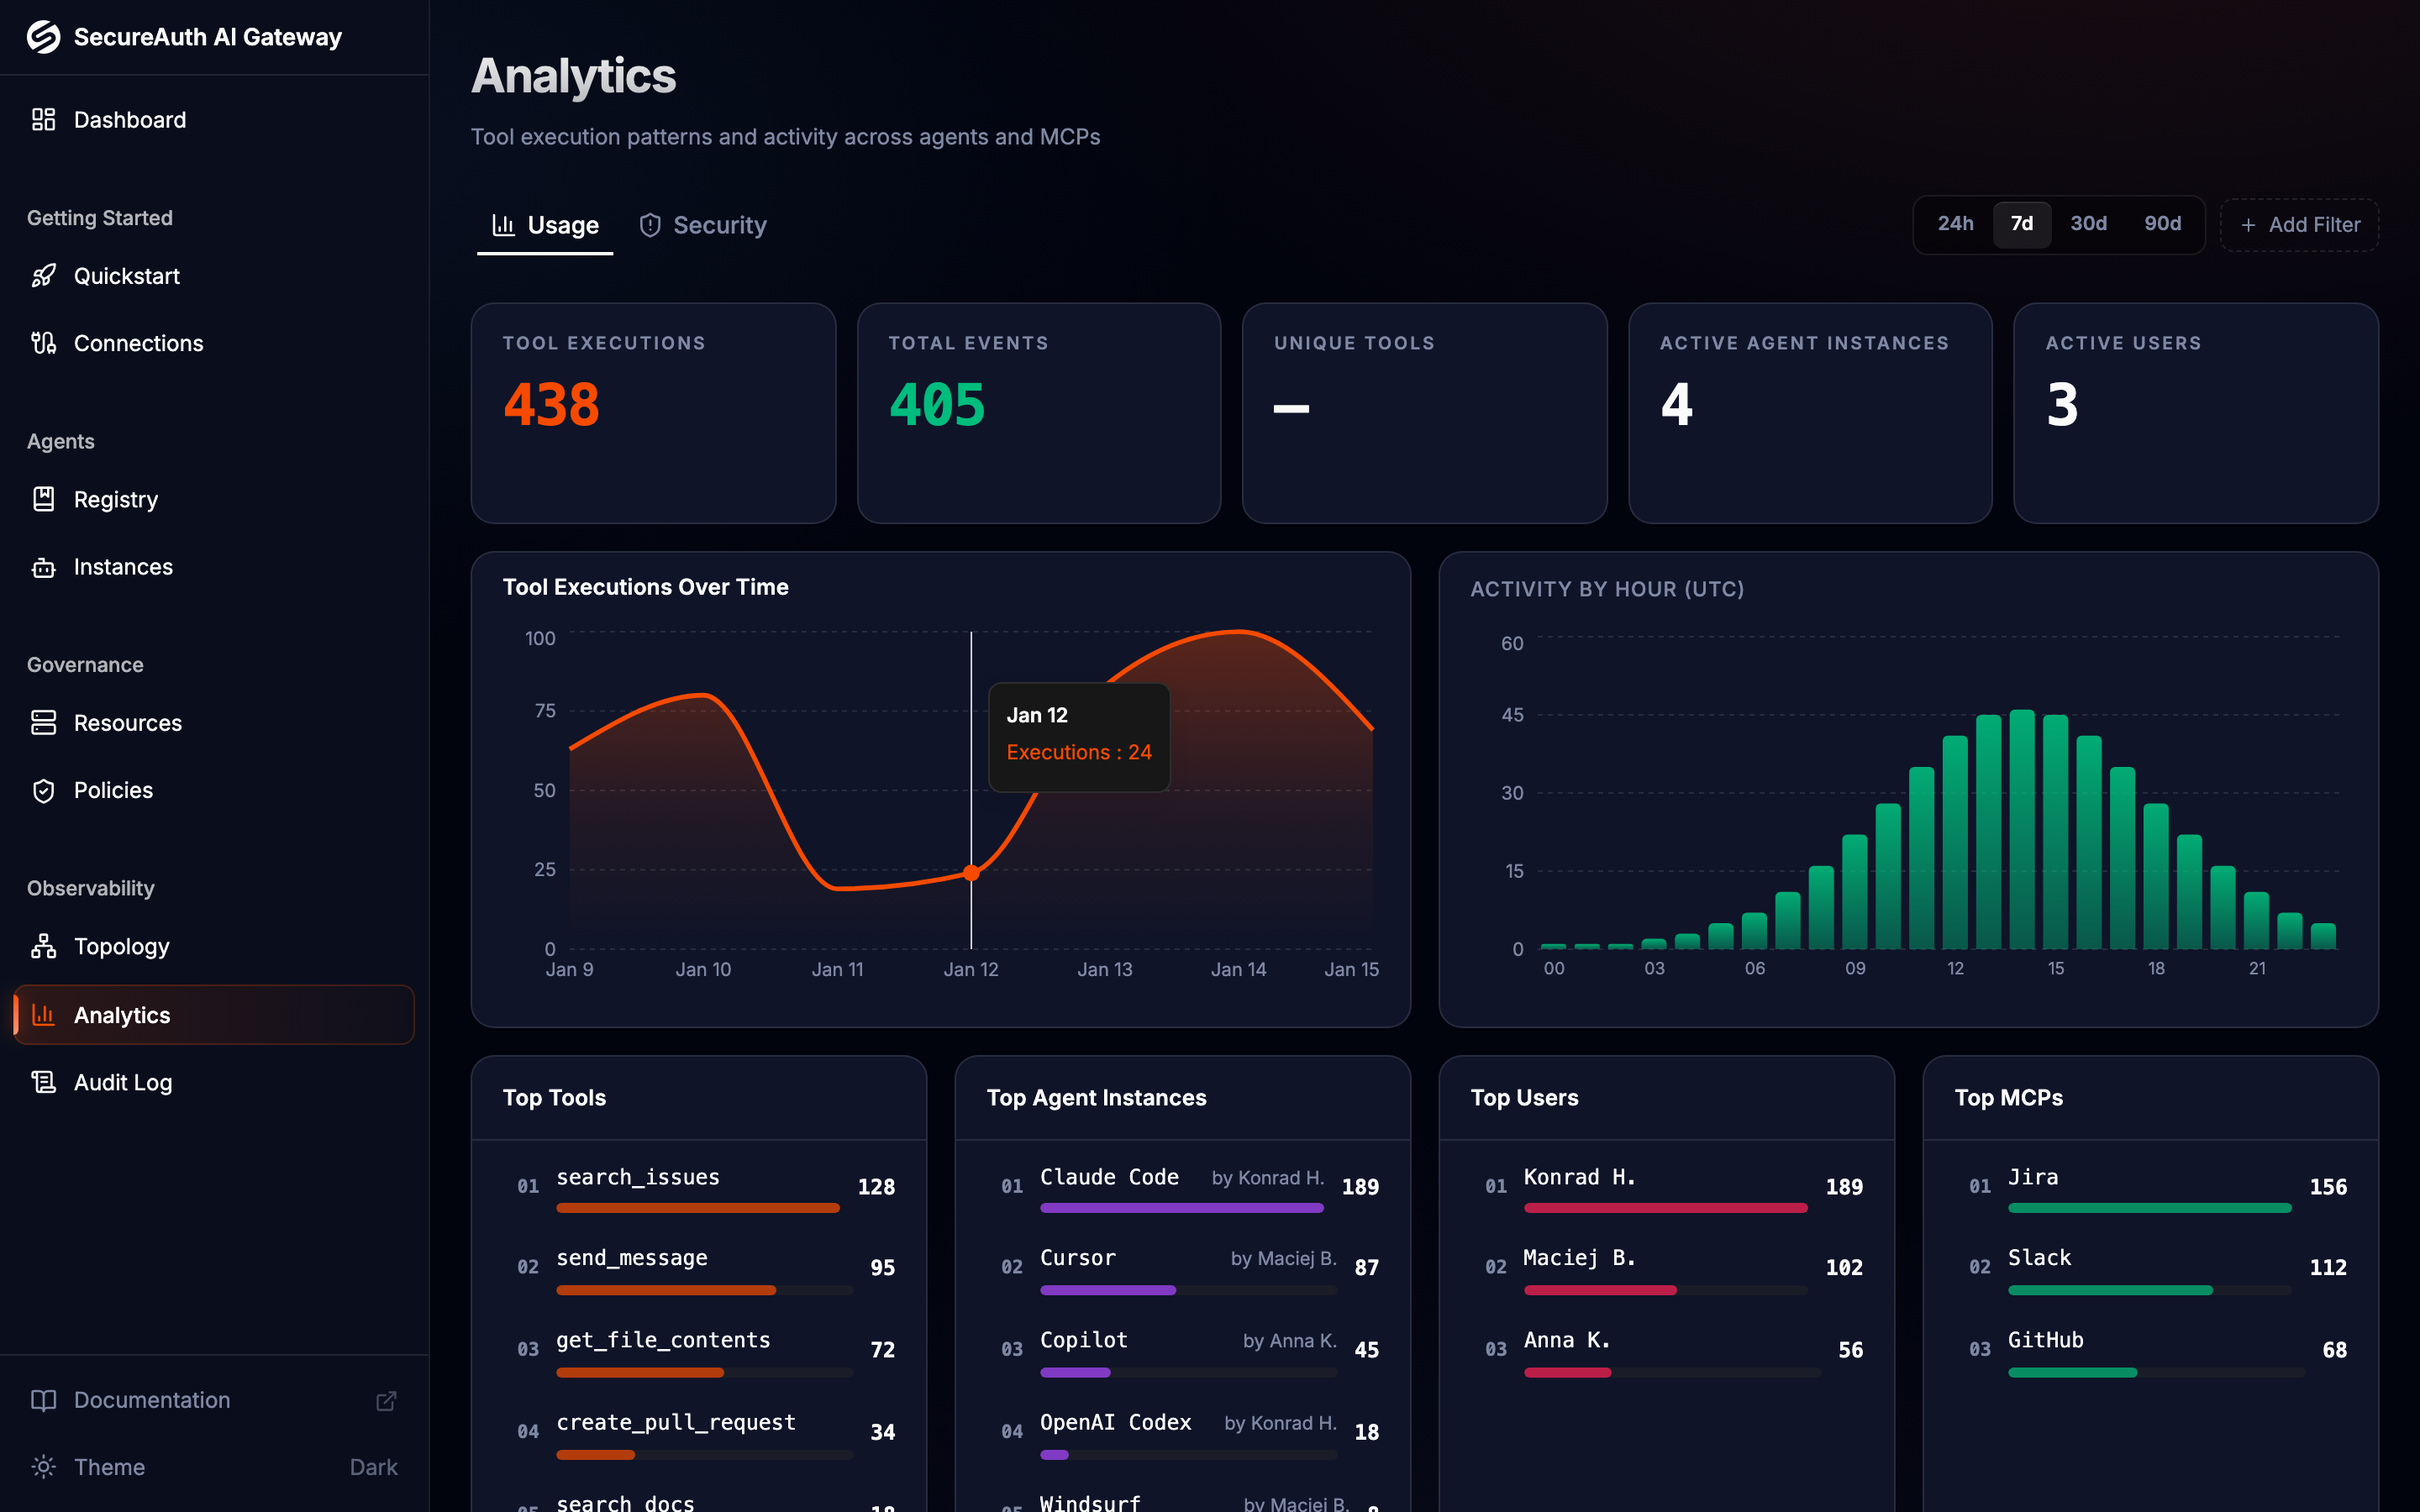
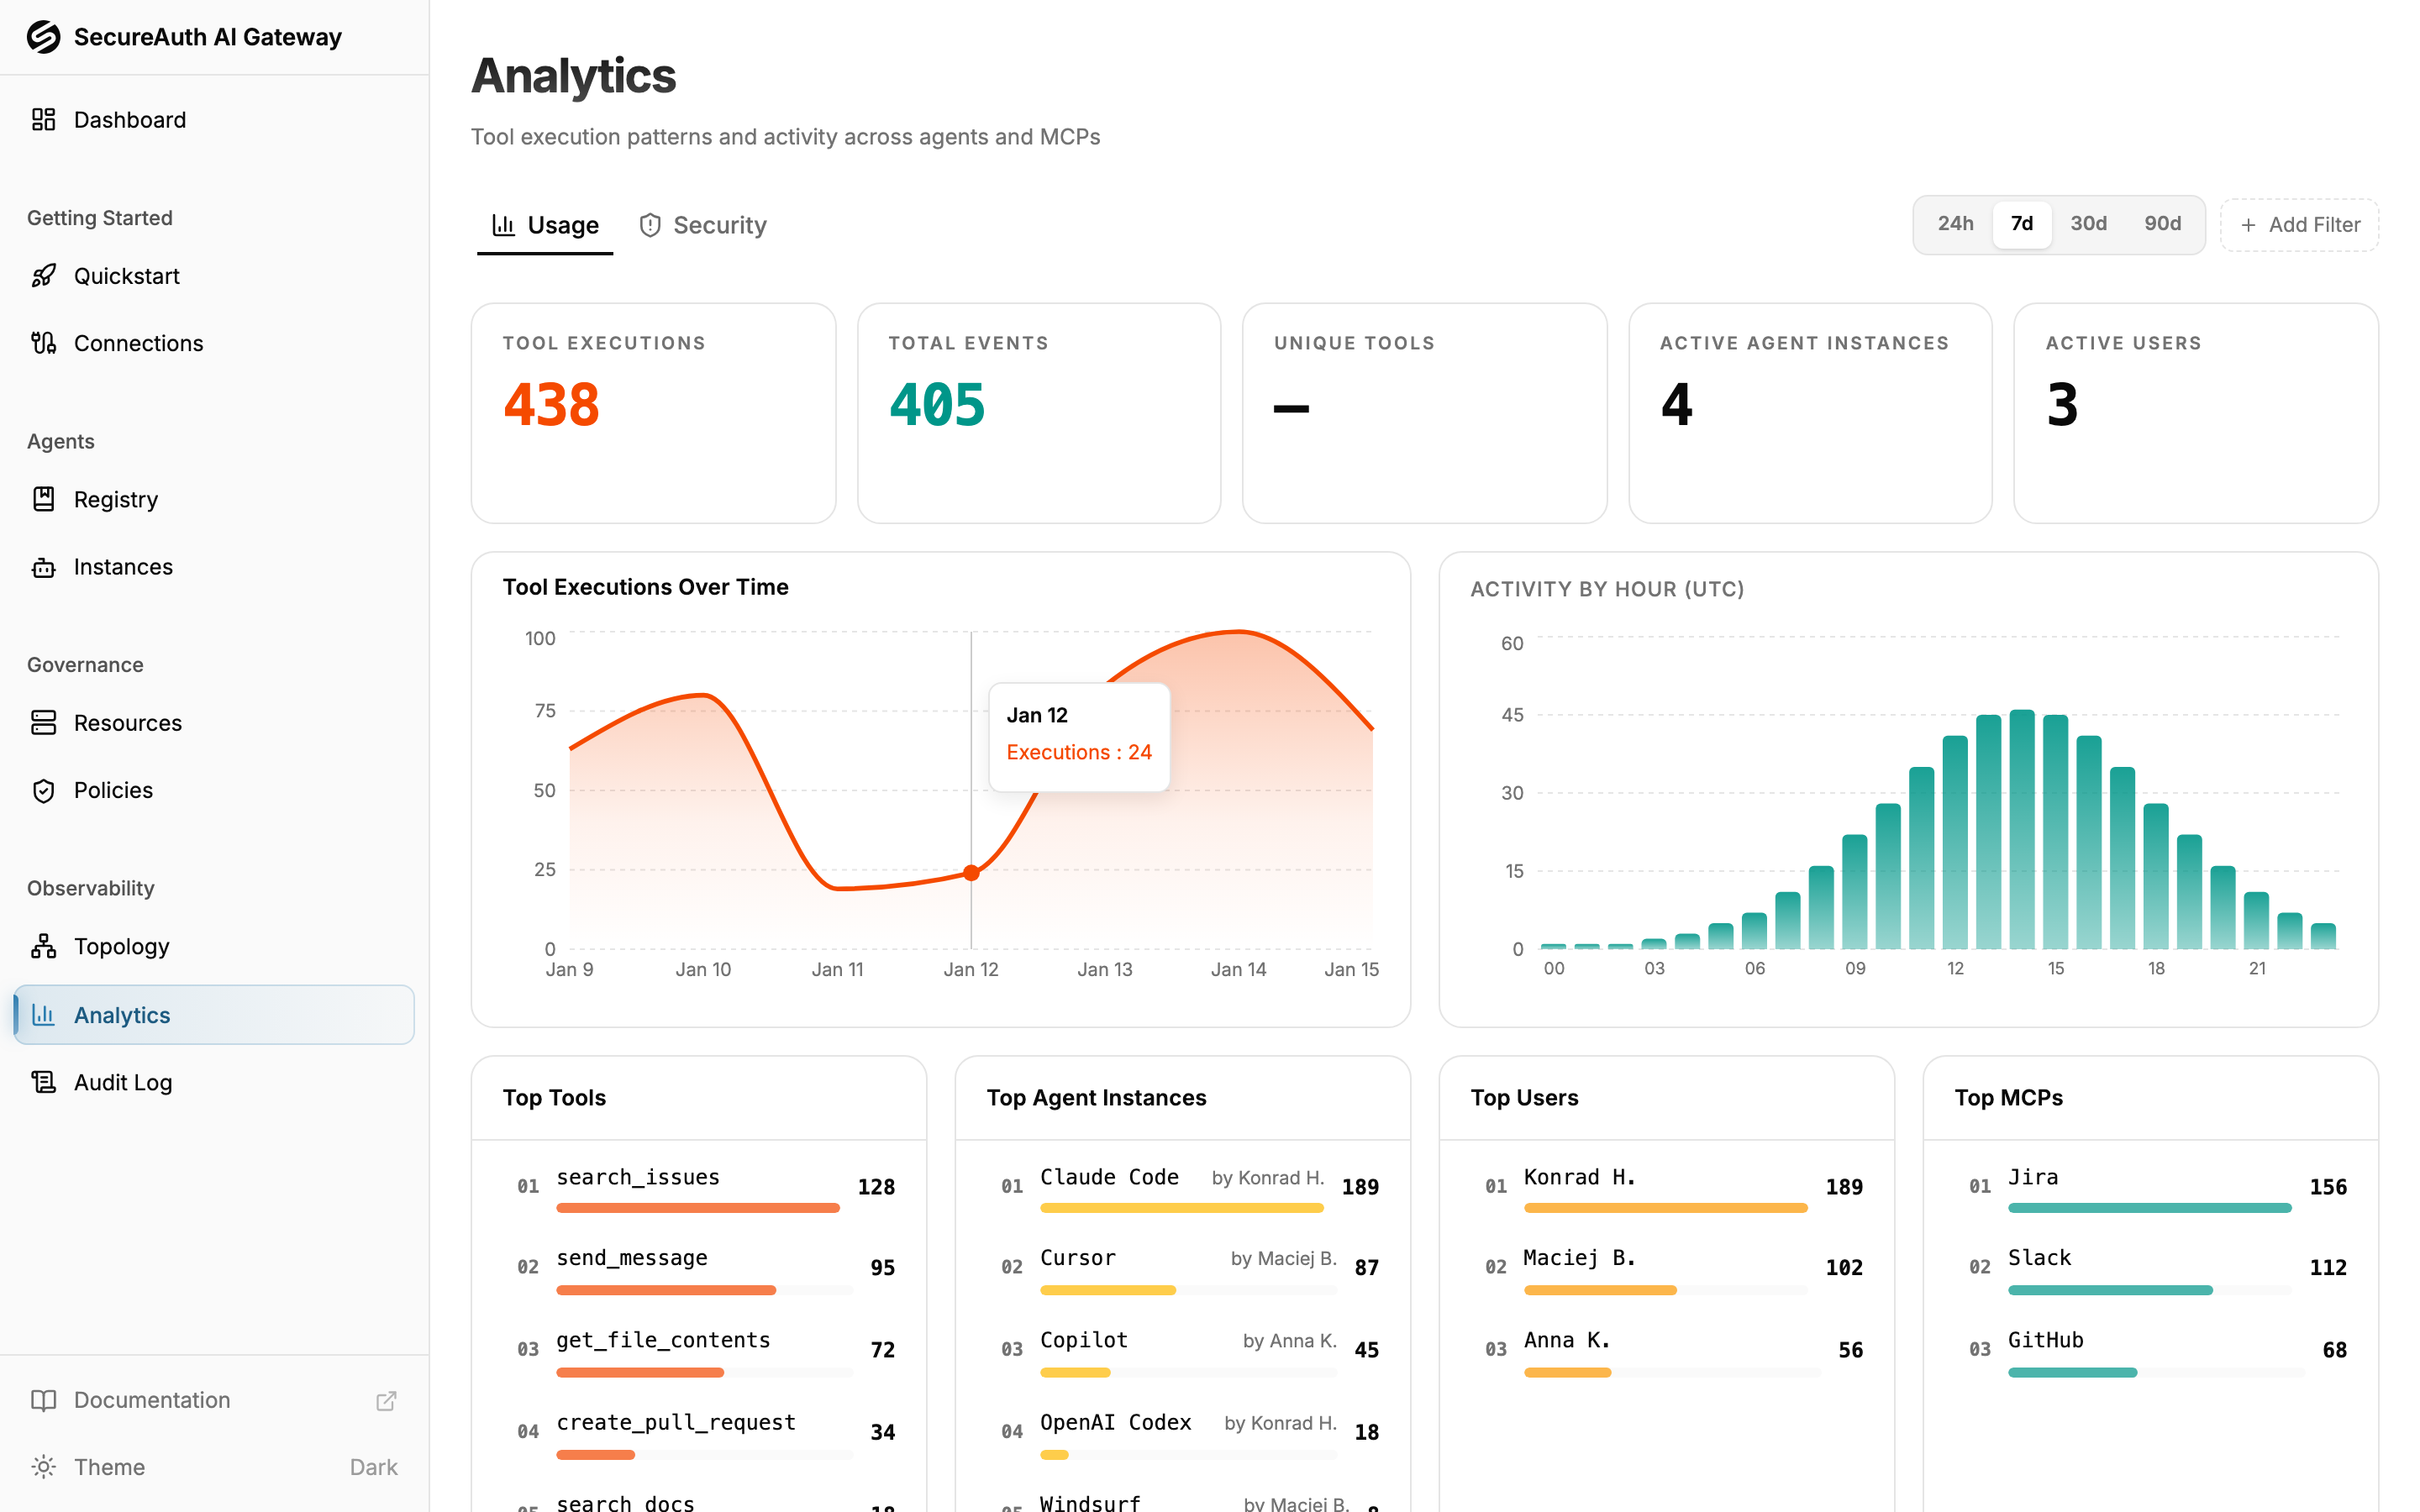
Tool-call activity across all agents and MCP servers:
- Tool executions, unique tools, active agent instances, active users — headline counts for the selected period
- Tool executions over time — line chart of activity trends
- Hourly distribution — tool call volume by hour of day (UTC)
- Top tools — most frequently called tools, with the owning MCP (paginated, 10 per page)
- Top agent instances — most active agents by execution count, with the owning user (paginated, 10 per page)
- Top users — most active users by tool execution count (paginated, 10 per page)
- Top MCPs — most used MCP servers (paginated, 10 per page)
LLM Usage
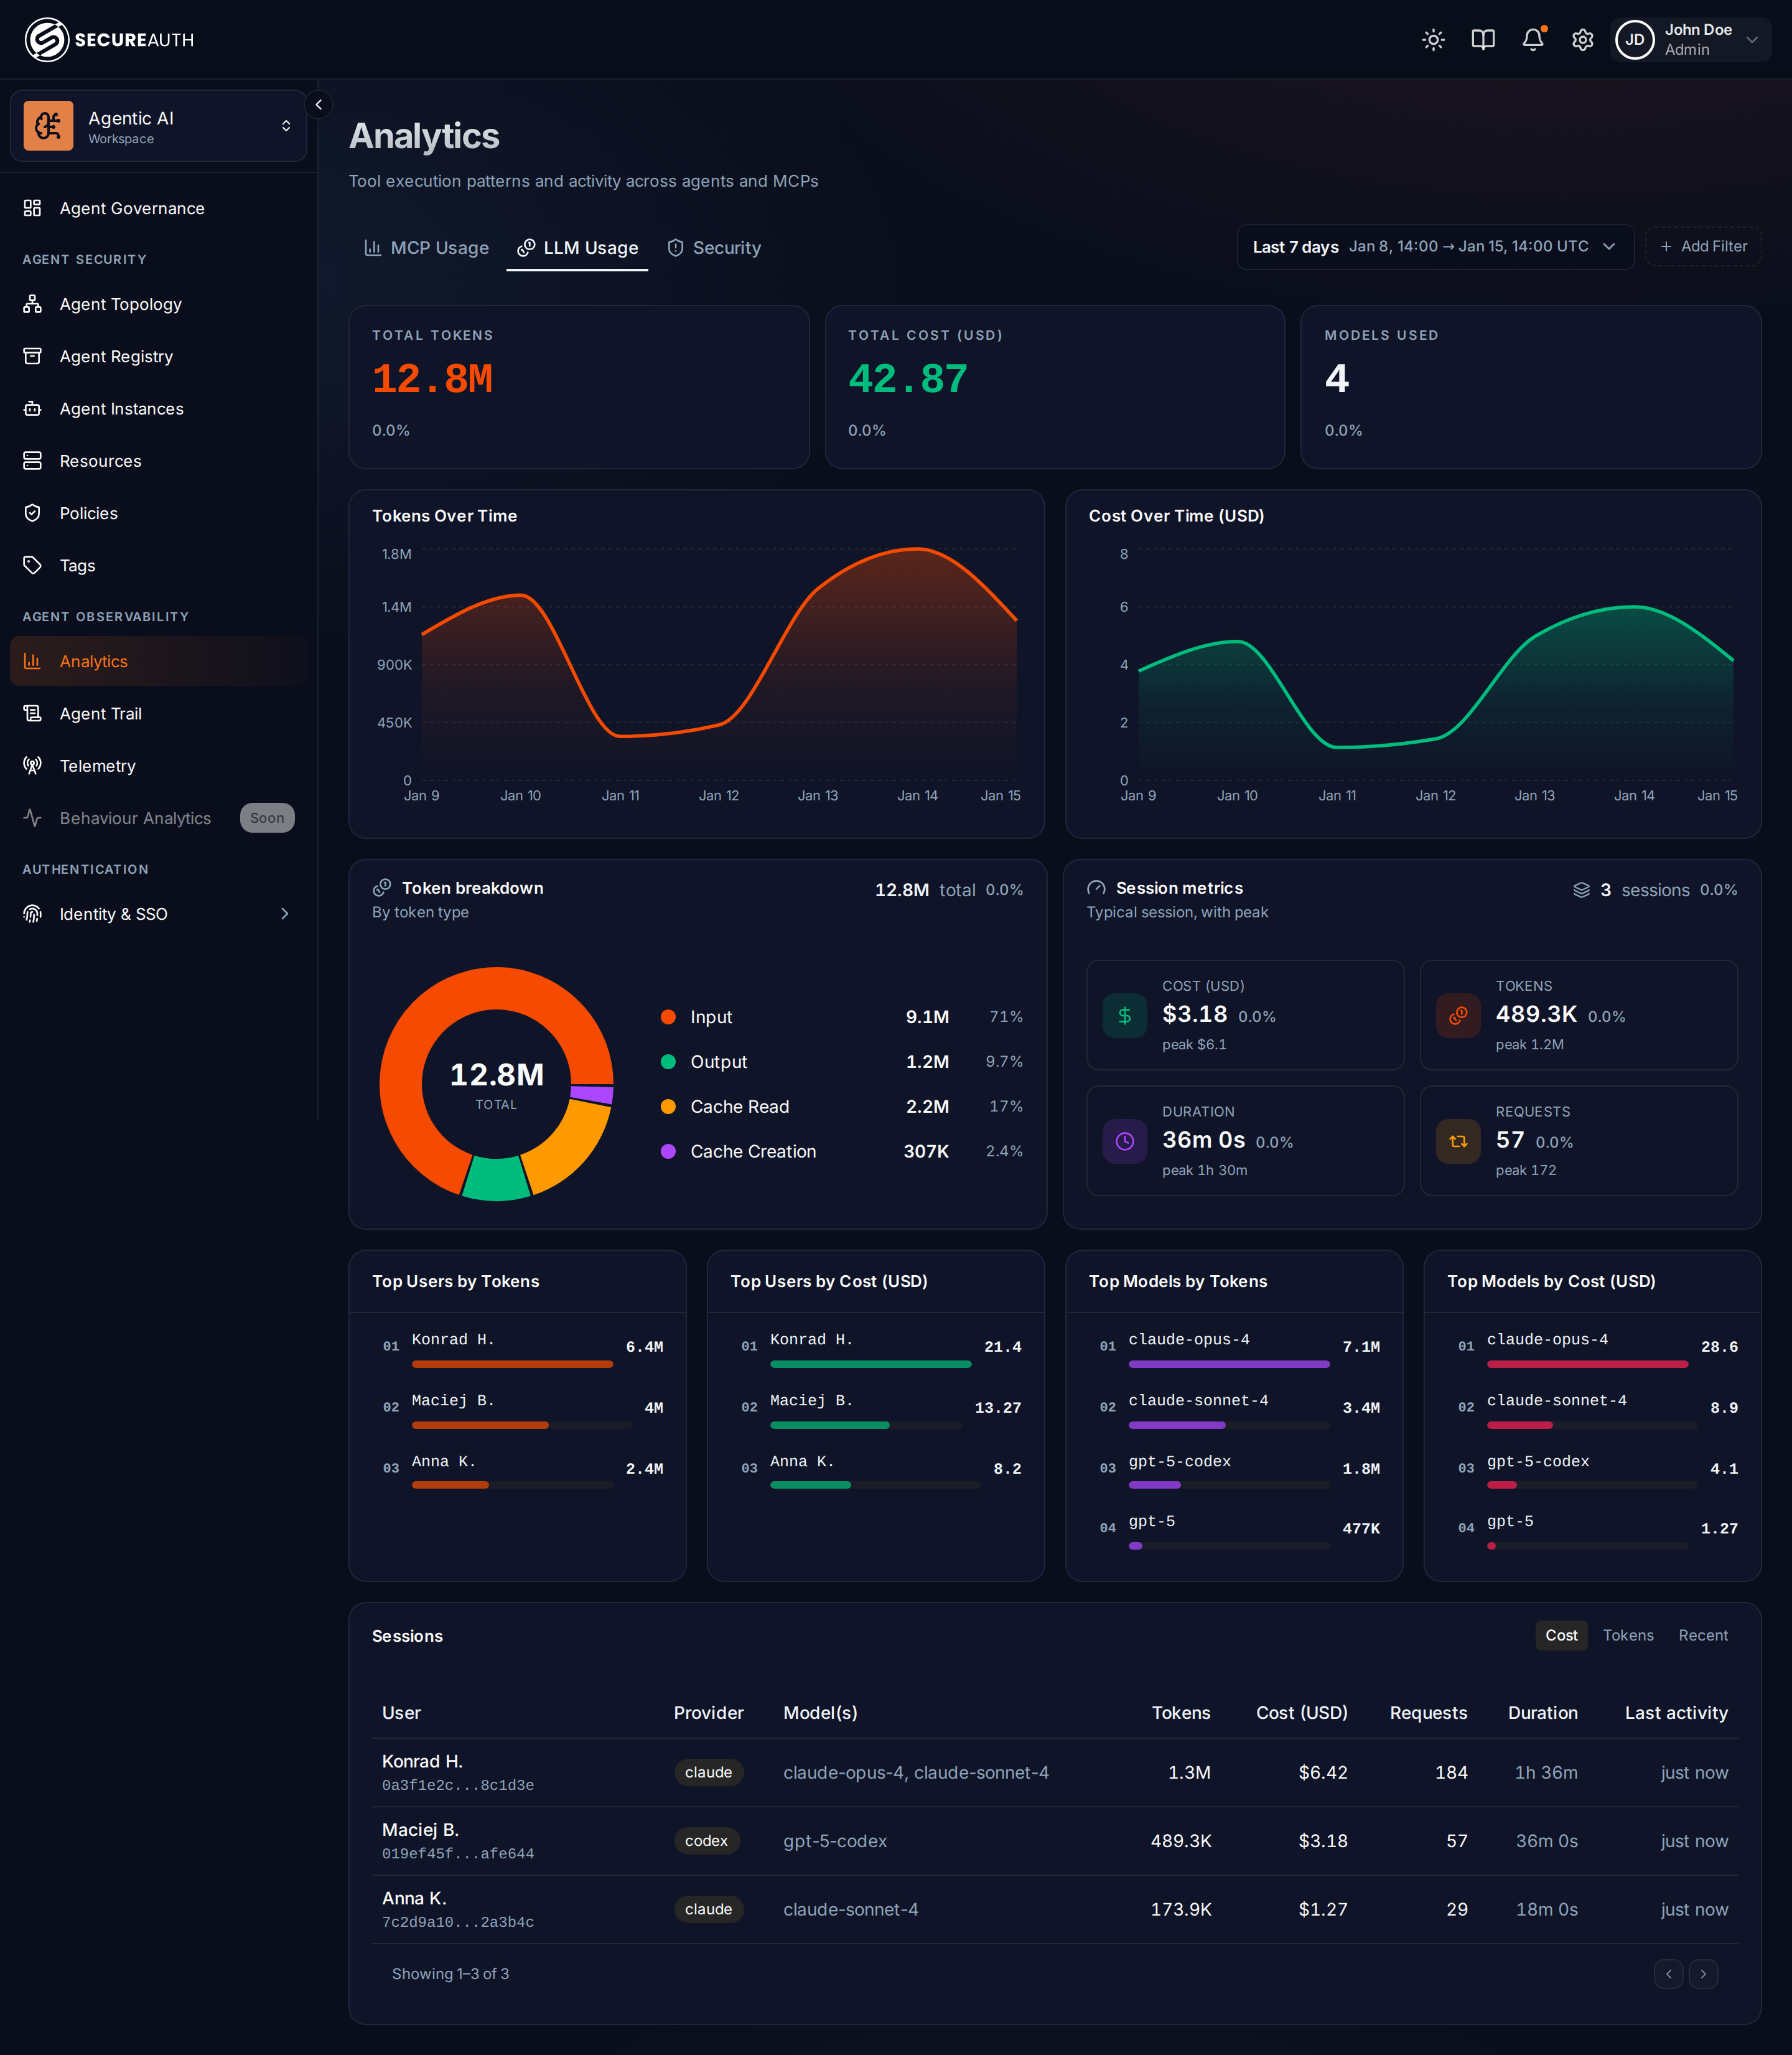
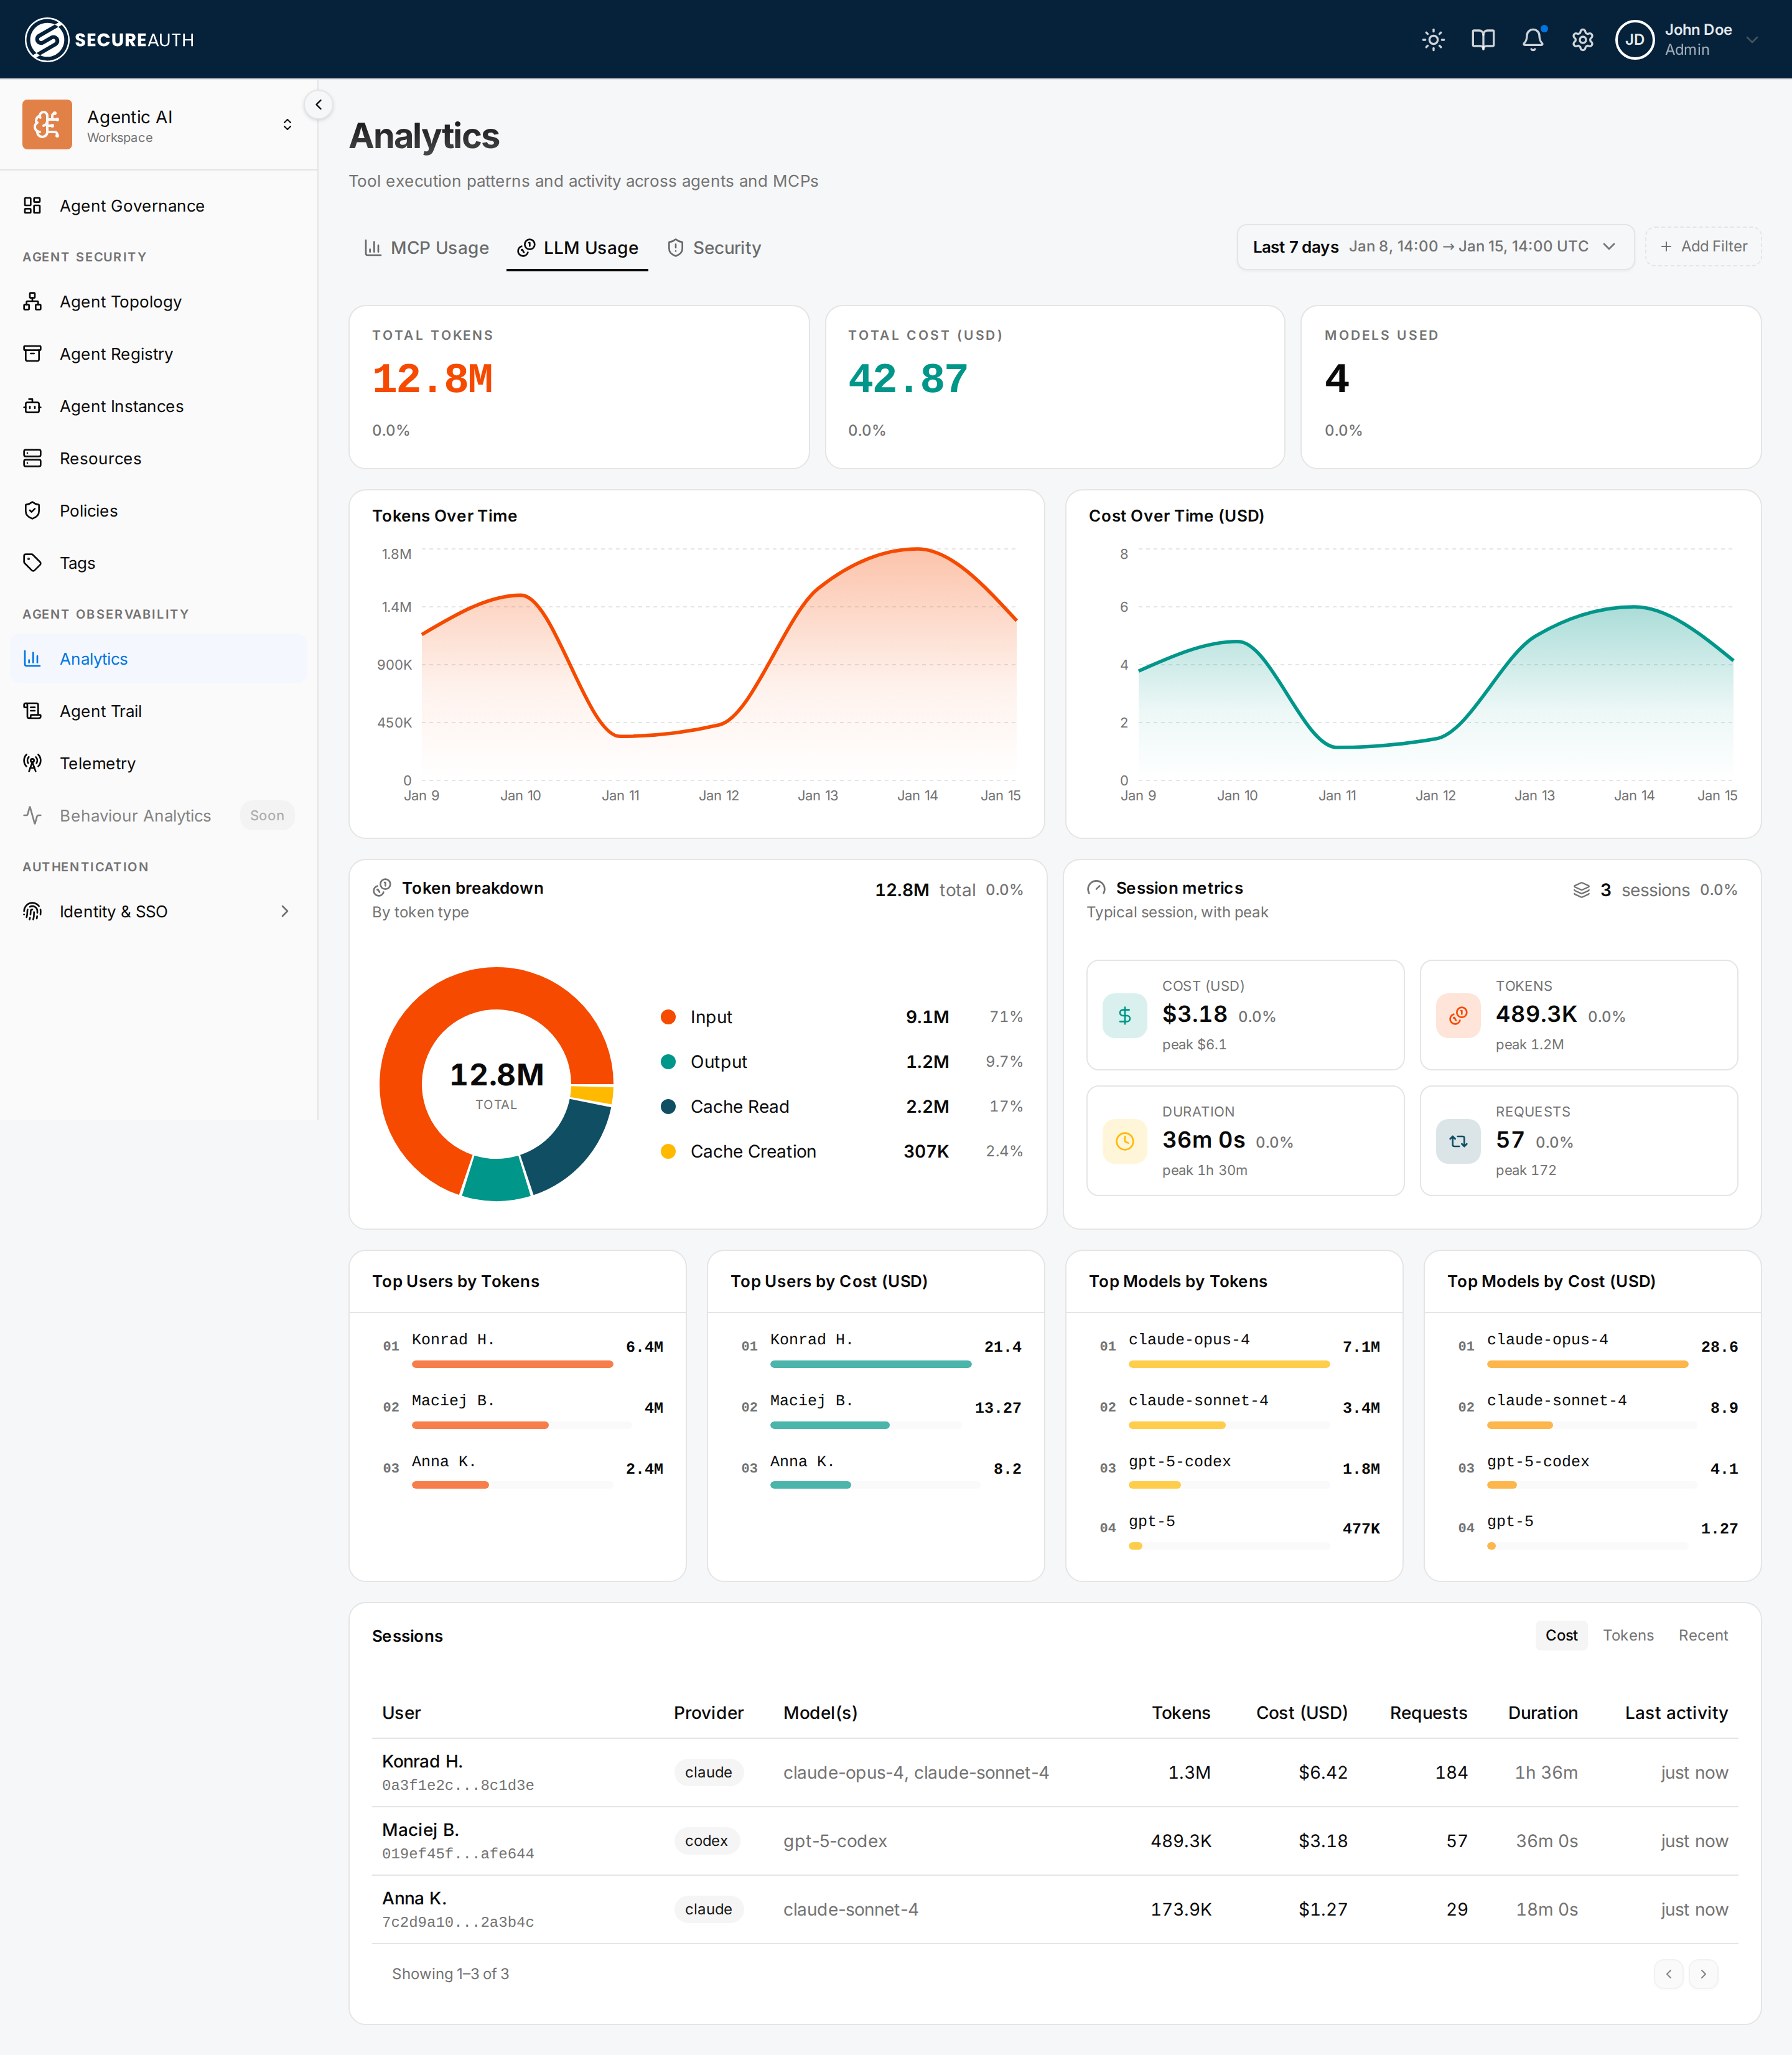
Token consumption and cost across your coding agents, powered by OpenTelemetry data they send to the gateway:
- Total tokens, total cost (USD), models used — headline figures for the selected period
- Tokens by type — usage split across input, output, and cache token types
- Tokens over time and cost over time (USD) — line charts of consumption trends
- Top users by tokens and top users by cost (USD) — who is spending the most (paginated, 10 per page)
- Top models by tokens and top models by cost (USD) — which models drive usage and spend (paginated, 10 per page)
This tab is visible to admins with the LLM-analytics permission. Until your agents are configured to send telemetry it shows an empty state linking to the Telemetry page — see the OpenTelemetry guide for how to connect Claude and Codex, including turning it on org-wide.
Per-session usage
The Sessions table ranks individual agent sessions by cost, token consumption, or recency. Each session reported by an agent becomes one row in the table.
Click any row to open the Session timeline drawer. Alongside the session's totals, model breakdown, and token mix, it charts activity over the session's lifespan: tokens over time (bucketed, so you can see when the agent was working hard versus idle) and cumulative cost. A per-model rollup drives the Models card and average latency.
Note: The session totals row is populated from telemetry metrics, while the activity charts are built from telemetry logs — if an agent exports only metrics, its totals appear but the activity charts are empty. Costs are estimates derived from list pricing rather than billed amounts.
Session metrics
Above the Sessions table, the Session metrics panel summarises the distribution of sessions that match the current date range and filters. It shows the session count plus three statistical cuts — median (P50), average, and P95 — for each of the four dimensions: cost (USD), total tokens, session duration, and request count. This lets you see at a glance what a "normal" session looks like and how far the tail extends.
The panel respects the same provider, model, user, and date-range filters as the rest of the LLM Usage tab, so you can narrow it to a single model or user and immediately see how their sessions compare to the broader baseline.
Comparison chips in the session drawer
When you open a session drawer, each of the four dimensions (cost, tokens, duration, requests) displays a comparison chip next to the session's own value. The chip shows the ratio of that session to the typical (median) session: for example, a cost chip reading 2.1× median means this session cost about twice the typical session. Sessions in the top 5% of any dimension are flagged with a top 5% badge so outliers stand out without you having to scan the raw numbers.
If there are no baseline stats for the current filter set — for example, a newly added model with only one session — the chips are hidden rather than showing a meaningless ratio.
Security
The Security tab surfaces tool calls that were blocked by policy — useful for investigating which agents are hitting policy boundaries and which policies are doing the most enforcement.
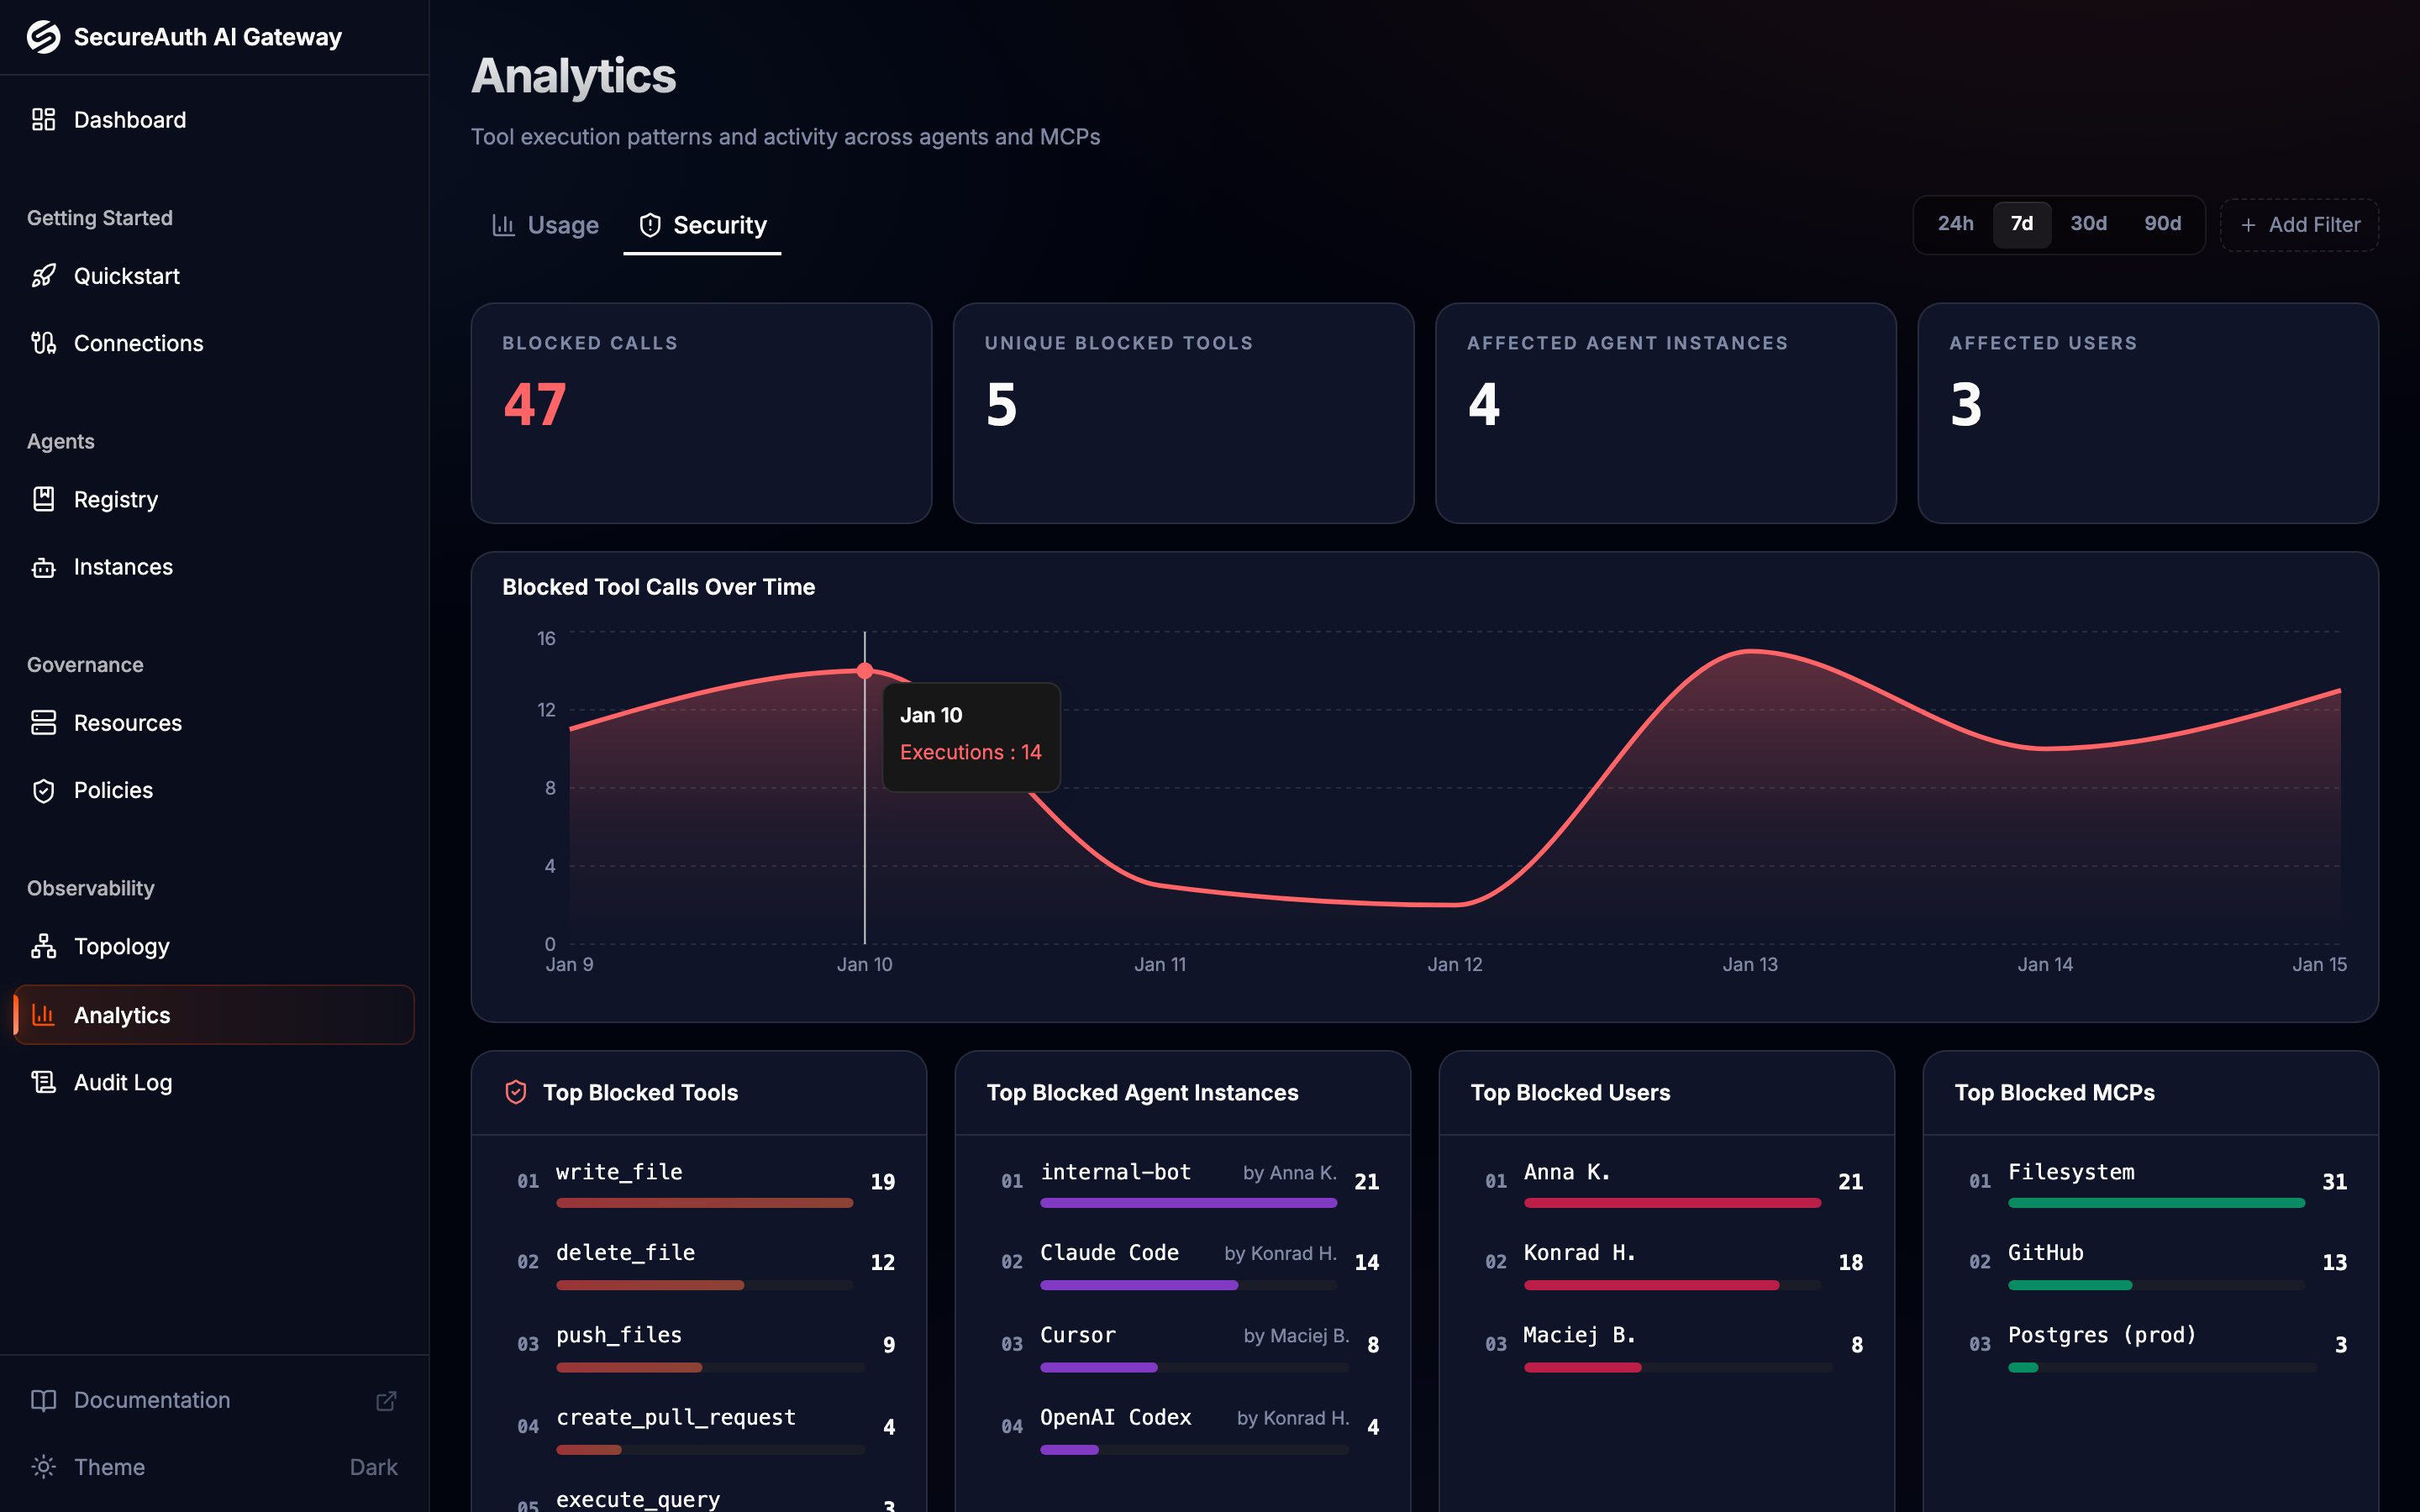
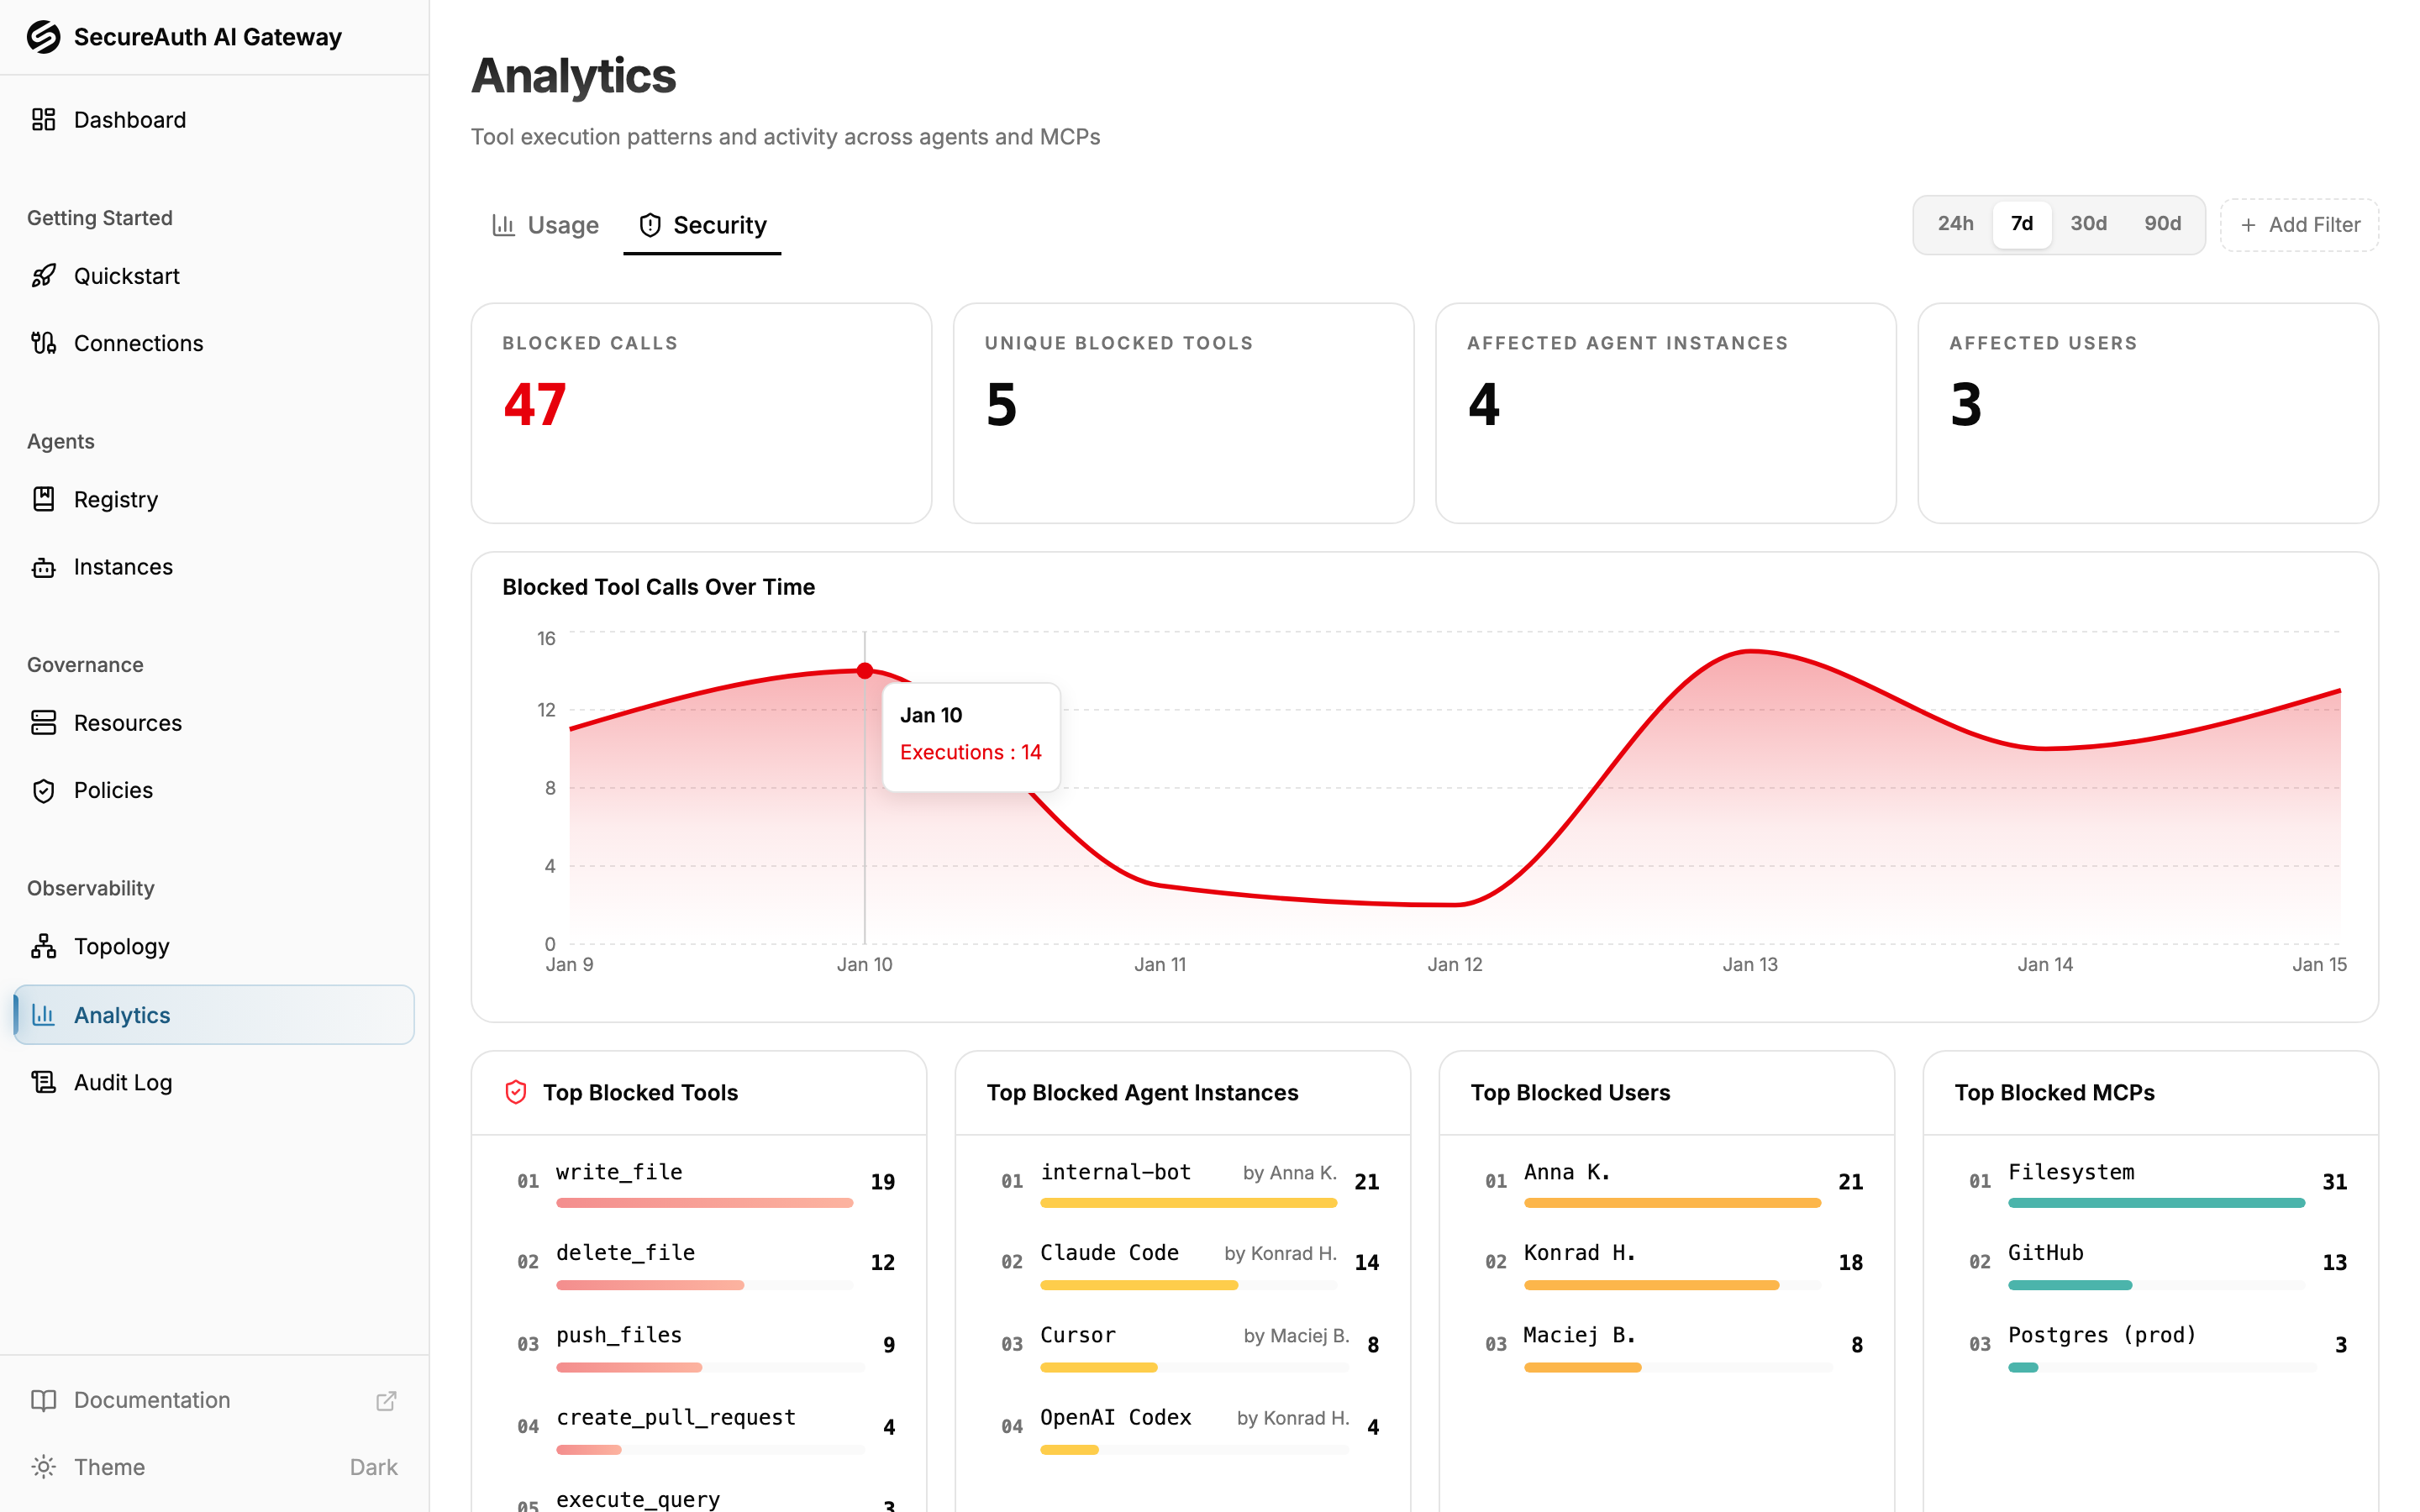
- Blocked calls — total count of policy-blocked tool calls in the selected period
- Blocked tool calls over time — line chart showing when blocks happen
- Top blocked tools / agent instances / users / MCPs — what's hitting policy walls (paginated, 10 per page)
- Top blocking policies — which policies are doing the most enforcement (paginated, 10 per page)
Each blocked tool event in the audit log references the policy that caused the block (id, name, description), so you can identify the responsible policy even if it has since been modified or renamed.
Filters
Every tab shares the date-range picker (see below) and User and Group filters. Selecting one or more groups narrows the charts to their current members — membership is evaluated as it stands today, the same way the User filter works. Each tab then adds the dimensions specific to its data:
- MCP Usage and Security — agent-instance, agent, MCP, and tag filters (an Agent tag chip scopes to agents carrying it; a Resource tag chip to the MCP servers and tools carrying it).
- LLM Usage — Provider and Model.
Filters combine.
Date-range picker
The picker offers two preset groups plus a custom mode:
- Rolling — a trailing window ending now:
Last 1h,Last 24h,Last 7 days,Last 30 days,Last 90 days. The window slides forward in real time. - This (period-to-date) — from the start of the current calendar period to now, growing as the period progresses: Today, This week, This month, This quarter, This year.
- Custom — pick an exact start and end via a dual-calendar with time-of-day, useful for investigating a specific incident window.
Times are shown in your local timezone, and the time-series bucket size is chosen automatically (hourly for spans up to two days, otherwise daily). Every chart automatically overlays the equivalent preceding window as a dashed Previous period series, so you can see trends at a glance.
The selected range is encoded in the page URL, so you can bookmark or share a specific view and it reloads exactly as you left it.