Guides
Dashboard
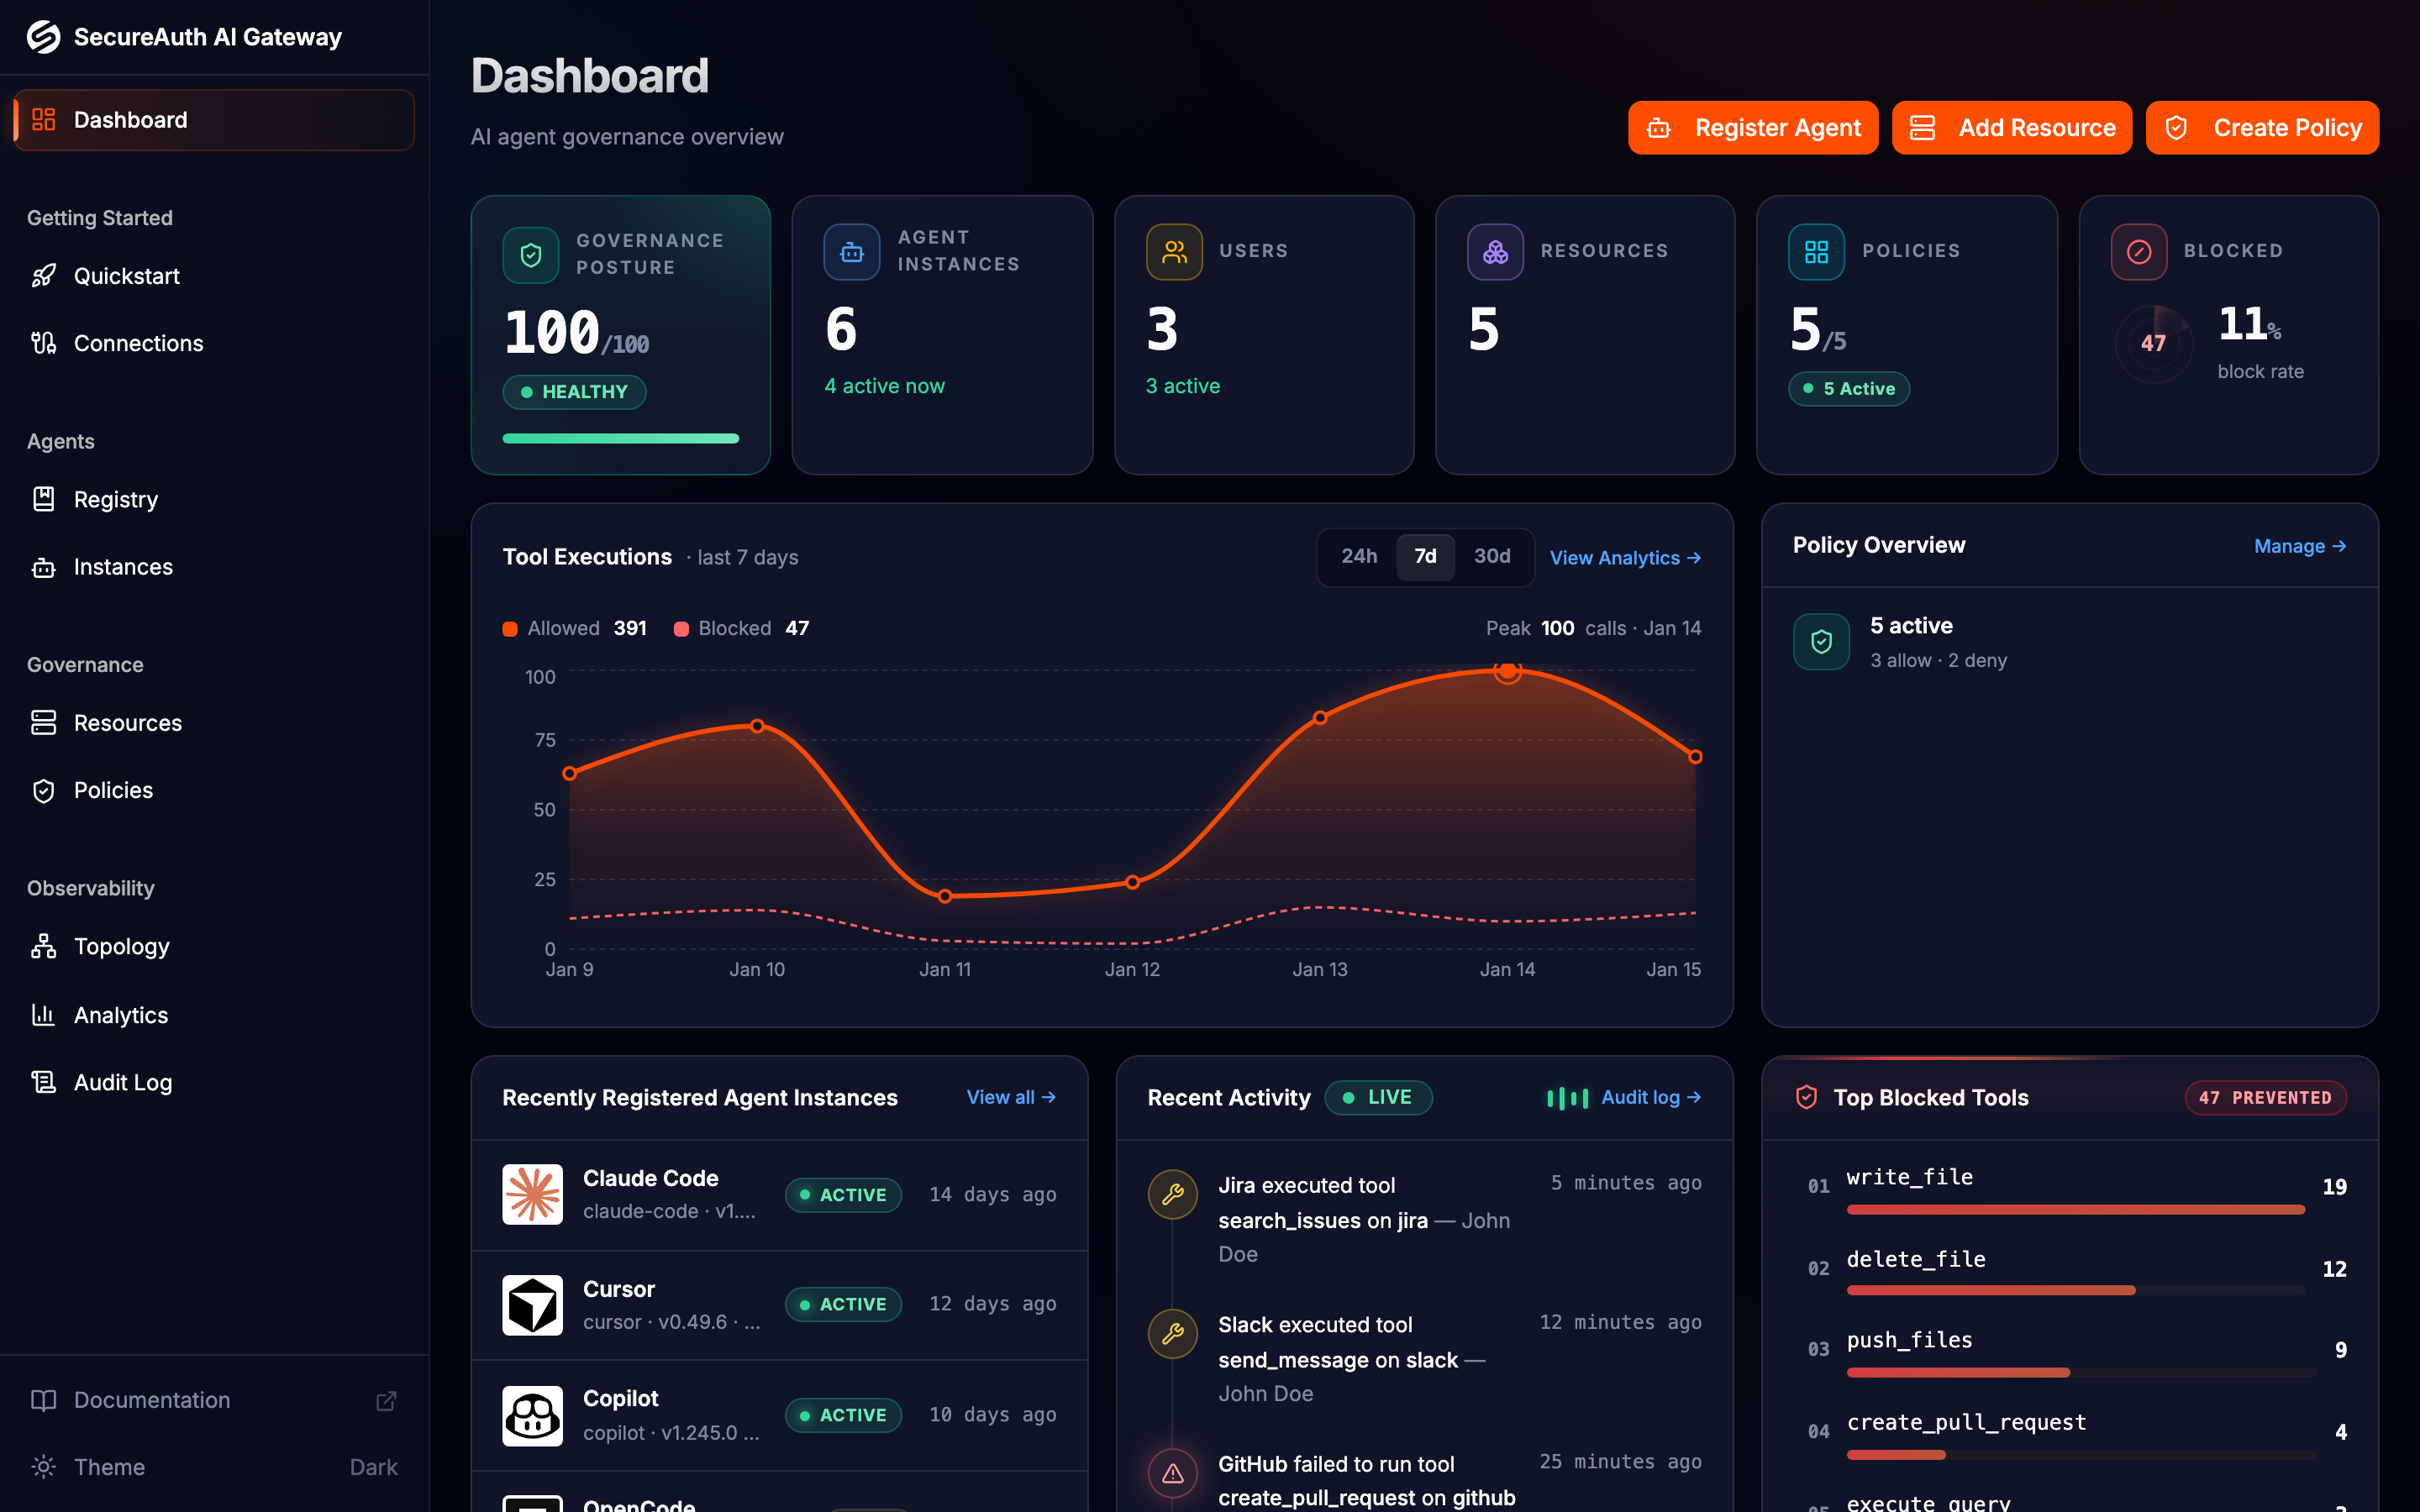
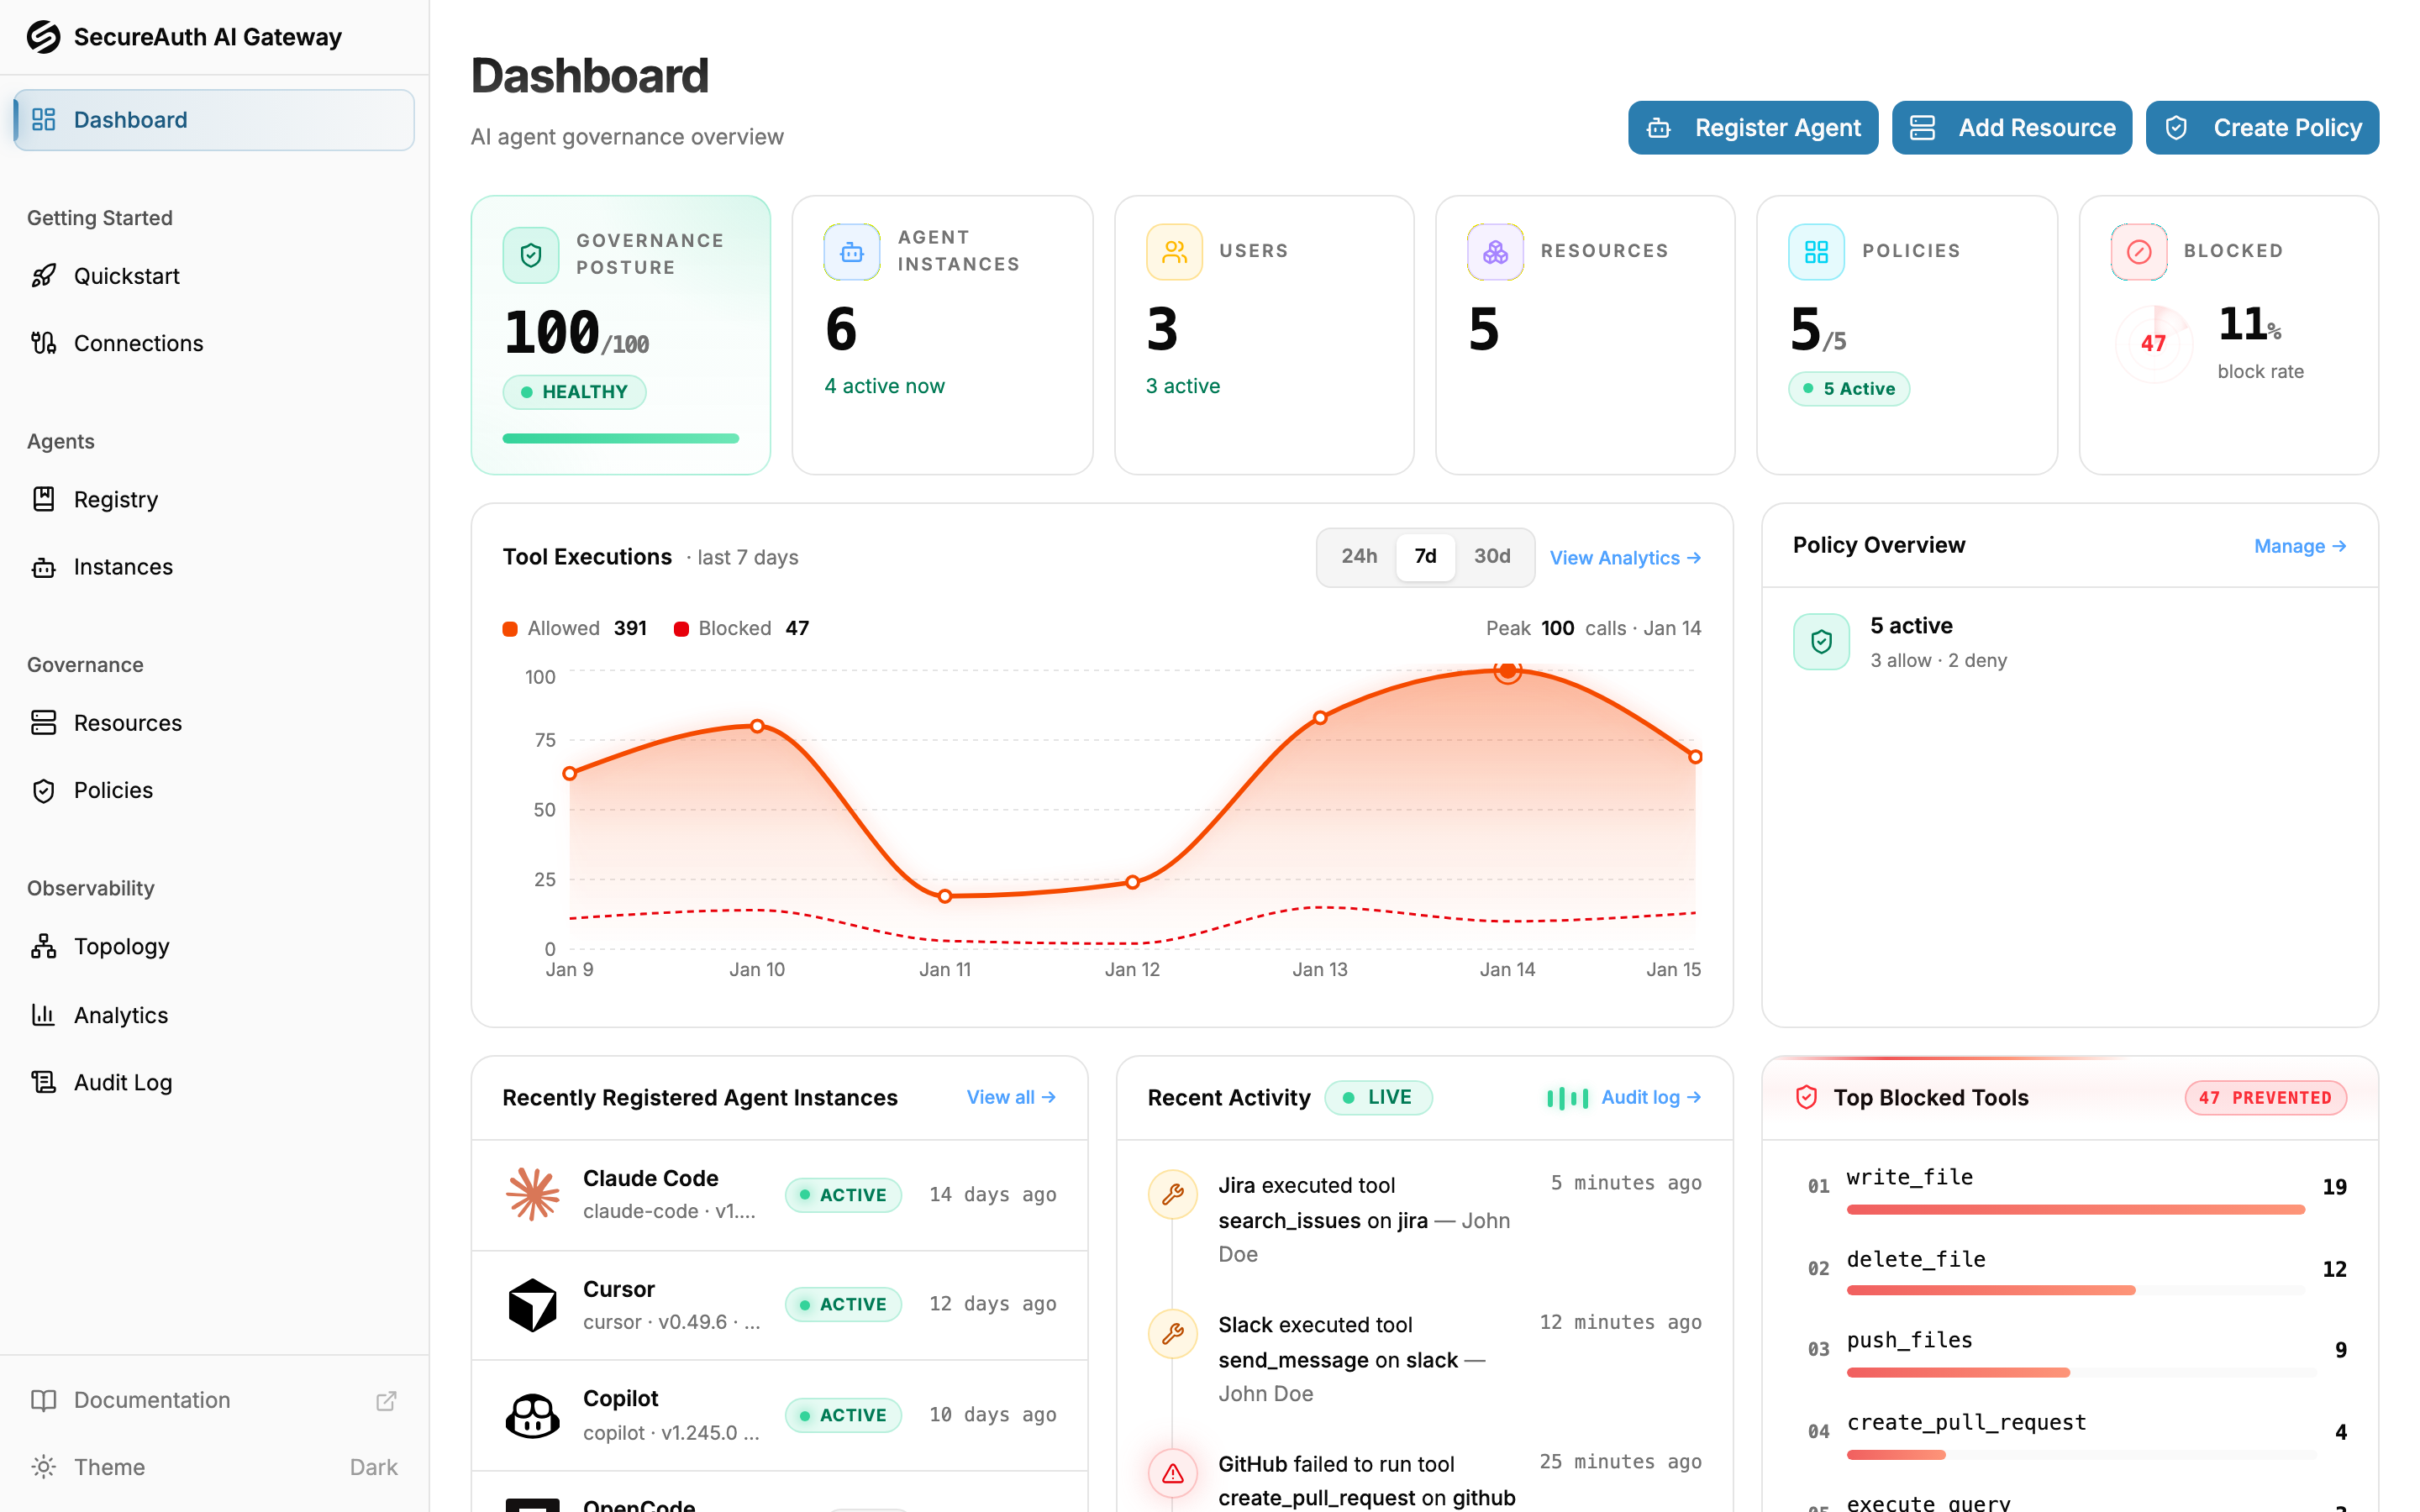
A high-level governance overview of agents, resources, policies, and activity
The dashboard is the landing page once agents are connected and making tool calls — a high-level view of your organization's governance posture.
Key metrics
The dashboard groups key metrics into themed cards:
- Gateway health — the share of tool calls that executed successfully (success rate), with a count of real errors such as timeouts and upstream failures (policy blocks are excluded — those are intended)
- Inventory — counts of agents, users, resources, and policies (active / total)
- LLM usage — total spend, tokens consumed, and the number of distinct models
- Gateway traffic — total requests through the gateway, plus how many were blocked and the resulting block rate
Below the cards, two charts sit side by side: a tool executions trend (with a blocked-call count badge) and an LLM usage cost-over-time trend. The bottom row shows the top models by token usage, the recent activity feed, and the top blocked tools.
The LLM usage card, cost chart, and top-models widget populate once your agents report usage through OpenTelemetry. Until then, the cost and token figures read zero and a card invites you to connect telemetry.