Risk Intelligence dashboard
The Risk Intelligence dashboard provides detailed risk engine analytics for authentication events. Use it to monitor Level of Assurance (LoA) scores, track friction rates, see how individual risk analyzers (IP, browser fingerprint, location, ML anomaly) score each authentication, and detect credential stuffing patterns. Data updates hourly.
For authentication system health and MFA adoption metrics, see Authentication Summary. For threat alerts like leaked credentials and failed login spikes, see Risk Insights.
The dashboard is organized into two tabs:
- Overview shows authentication activity, risk quality indicators, geographic distribution, anomaly detection trends, and a transaction log.
- Risk Assessment shows risky users, IPs, burst login detection, and credential stuffing patterns.
Overview tab
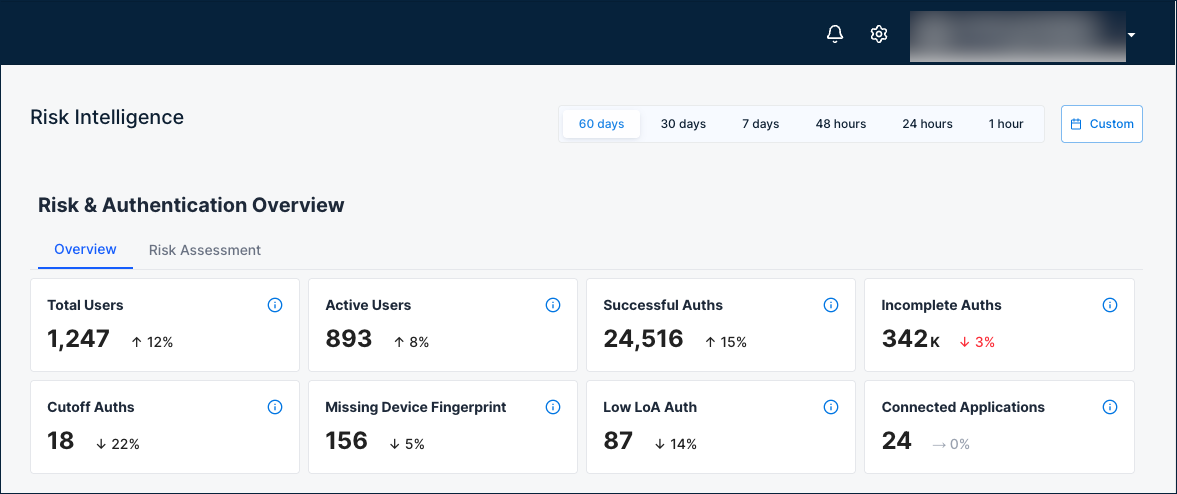
Risk and authentication overview
Eight summary cards show risk engine activity at a glance.
| Card | Description |
|---|---|
| Total Users | Total number of unique users in the risk engine, regardless of the selected time filter. |
| Active Users | Number of unique active users in the risk engine during the selected time range. |
| Successful Auths | Authentications completed successfully where auth and post-auth steps executed and the user security posture was updated. |
| Incomplete Auths | Authentications missing the post-auth call. The user security posture was not updated. |
| Cutoff Auths | Authentications where a cutoff rule (such as a red flag) was triggered, forcing the LoA to 0 regardless of other analyzer scores. |
| Missing Device Fingerprint | Authentications without a captured device fingerprint. Missing device data can lower LoA and increase friction. |
| Low LoA Auth | Authentications with a LoA score below the threshold. |
| Connected Applications | Total number of applications integrated with the risk engine. |
Why it matters: A quick snapshot of risk engine coverage. A high number of incomplete auths or missing device fingerprints may indicate integration issues that reduce risk evaluation accuracy. Cutoff auths show how often risk rules are forcing LoA to zero, which may warrant policy review. Low-LoA auths highlight authentications that fell below the confidence threshold.
When to check: At the start of each security review, or when investigating a spike in blocked authentications.
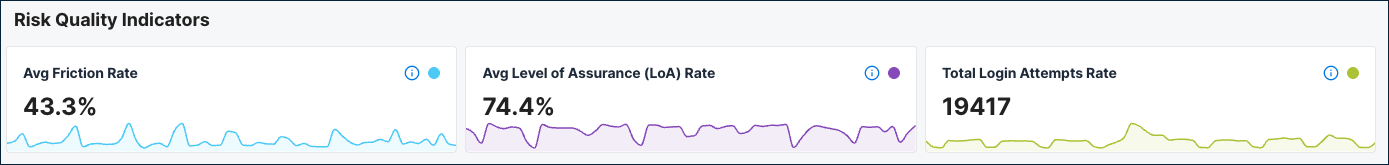
Risk quality indicators
Three gauges show key risk engine health metrics.
| Indicator | Description |
|---|---|
| Avg Friction Rate | Percentage of authentication attempts that required additional verification (step-up) during the selected time range. |
| Avg Level of Assurance (LoA) Rate | The average Level of Assurance across authentication events in the selected time range. |
| Total Login Attempts Rate | Total number of authentication attempts during the selected time range. |
Why it matters: These three metrics together tell you whether your authentication security is balanced. A declining LoA with rising friction means growing risk and more users being challenged. Monitor these after policy changes to measure their impact.
When to check: Regularly as key security metrics, and after any policy or configuration changes that affect authentication flows.
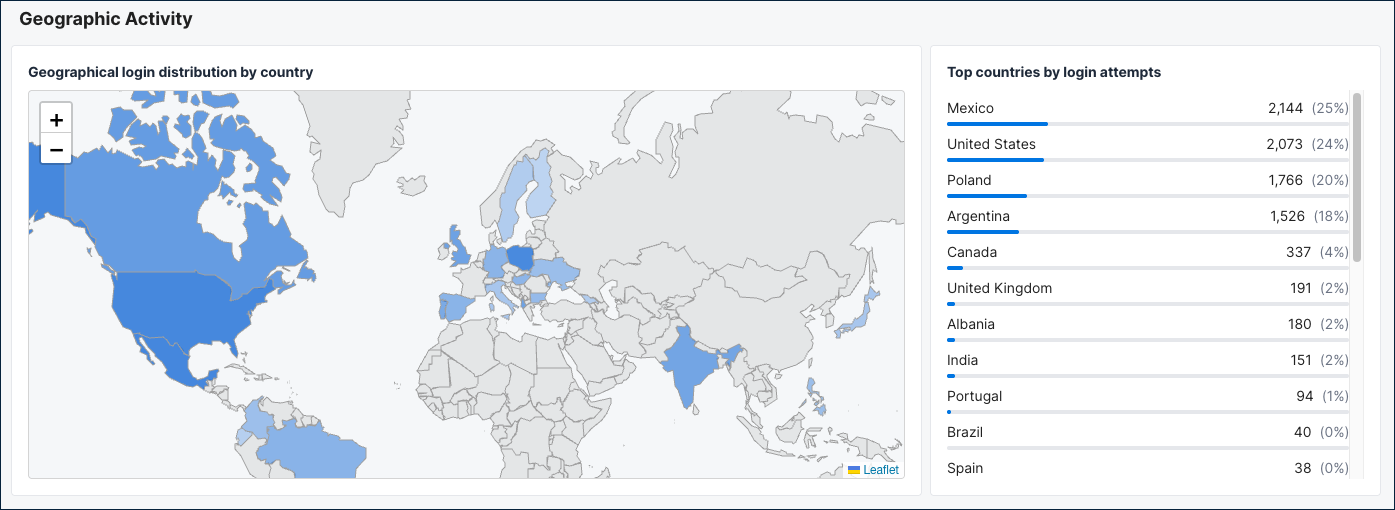
Geographic activity
A world map and ranked country list show where authentication events are coming from.
What it shows: The map displays login distribution by country with shaded regions indicating activity volume. The Top countries by login attempts table beside it ranks countries by authentication count.
Why it matters: Helps you visualize the geographic distribution of authentication activity and spot unexpected regions. If you see significant traffic from countries where you have no users, investigate further.
When to check: During security reviews, or when investigating geographic patterns in risky authentication activity.
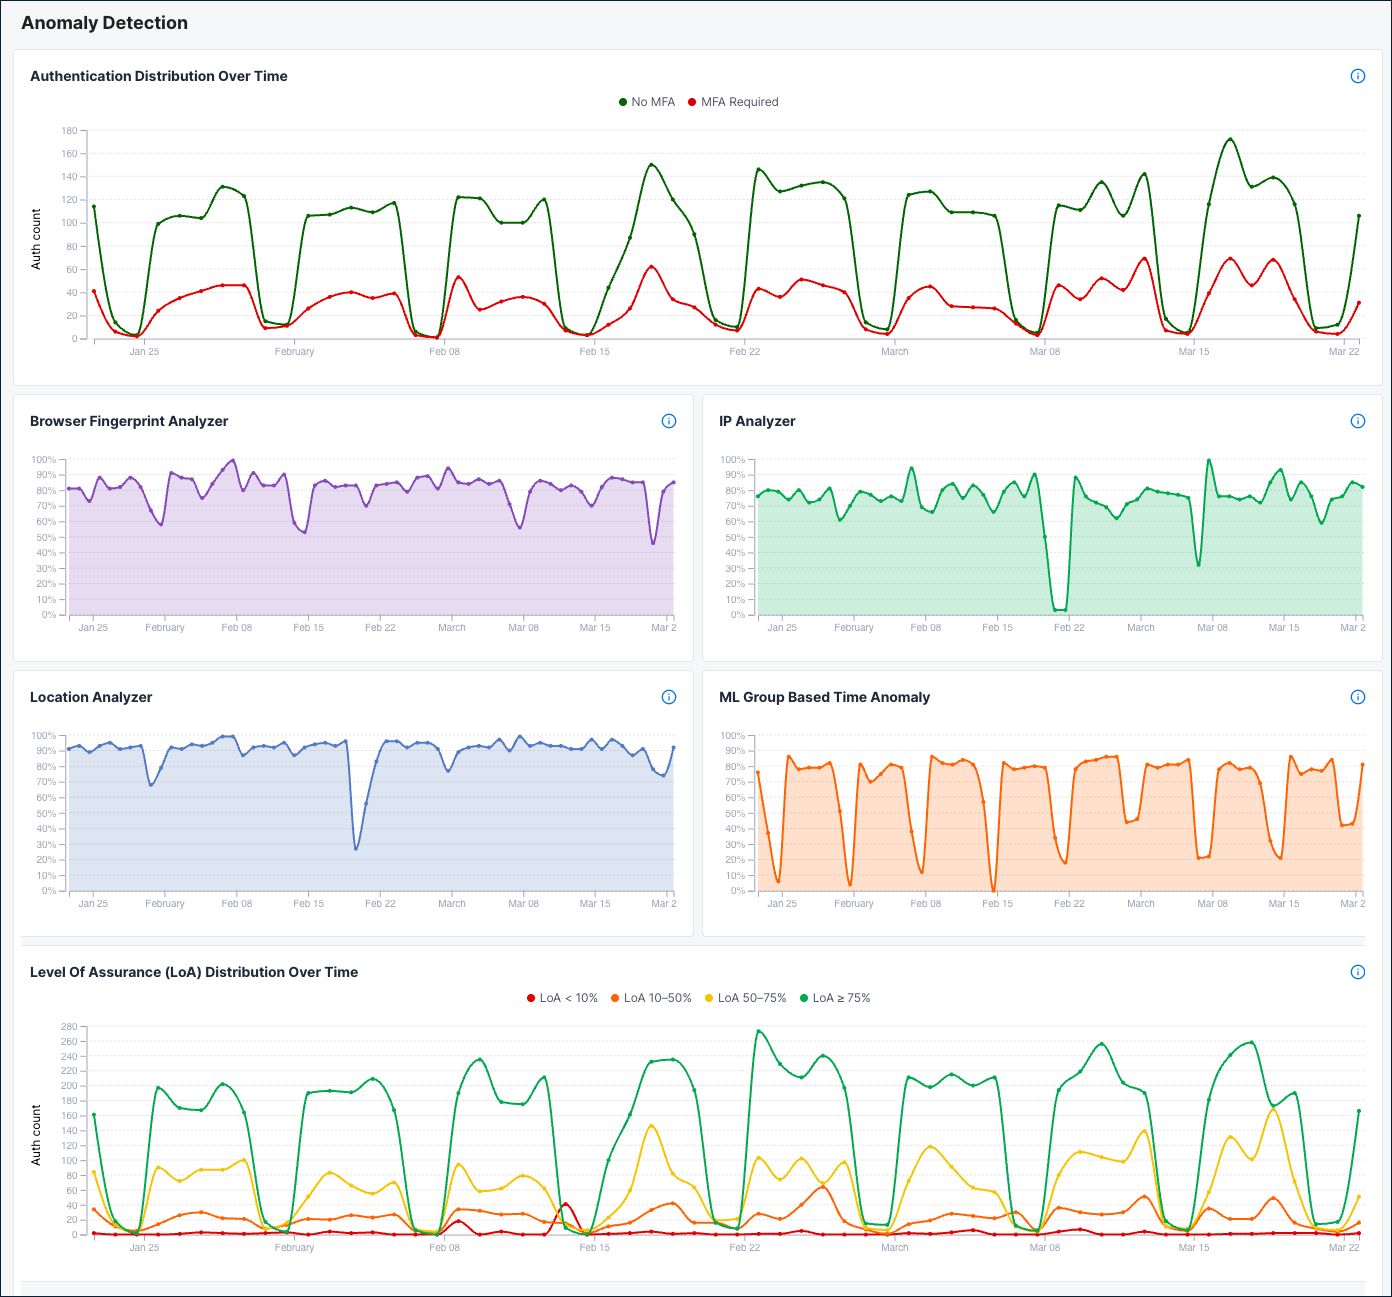
Anomaly detection
Six time series charts track risk analyzer behavior and authentication patterns over the selected time period.
Authentication Distribution Over Time Shows authentication attempts where the calculated LoA was 75 or above, allowing the user to authenticate without additional MFA. Use it to track how many authentications pass the frictionless threshold over time.
Browser Fingerprint Analyzer
Distribution of browser fingerprint analyzer risk scores during the selected time range.
IP Analyzer
Distribution of IP analyzer risk scores during the selected time range.
Location Analyzer
Distribution of location analyzer risk scores during the selected time range.
ML Group Based Time Anomaly
Distribution of ML group-based time anomaly risk scores during the selected time range.
Level of Assurance (LoA) Distribution Over Time
Shows how authentication events are distributed across different LoA ranges over time. Higher LoA values indicate stronger authentication confidence. Events are grouped into buckets: below 10%, 10-50%, 50-75%, and 75% or above.
When to check: When investigating why LoA scores are changing, or when troubleshooting risk engine behavior after policy updates.
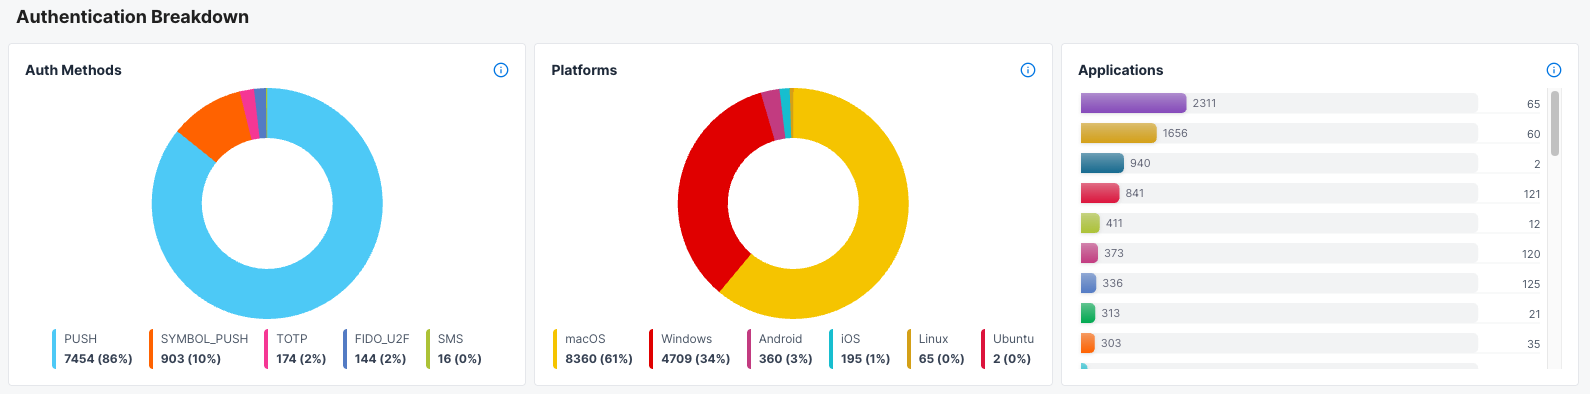
Authentication breakdown
Three charts show the distribution of authentication methods, platforms, and applications.
Auth Methods
Distribution of successful authentications by authentication method (such as password, SSO, or MFA) during the selected time range.
Platforms
Distribution of successful authentications by device platform (such as Windows, iOS, or Android) during the selected time range.
Applications
Distribution of successful authentications by application during the selected time range.
When to check: When reviewing which authentication methods and platforms are most common in risk-evaluated sessions, or when investigating whether a specific method or platform correlates with lower LoA scores.
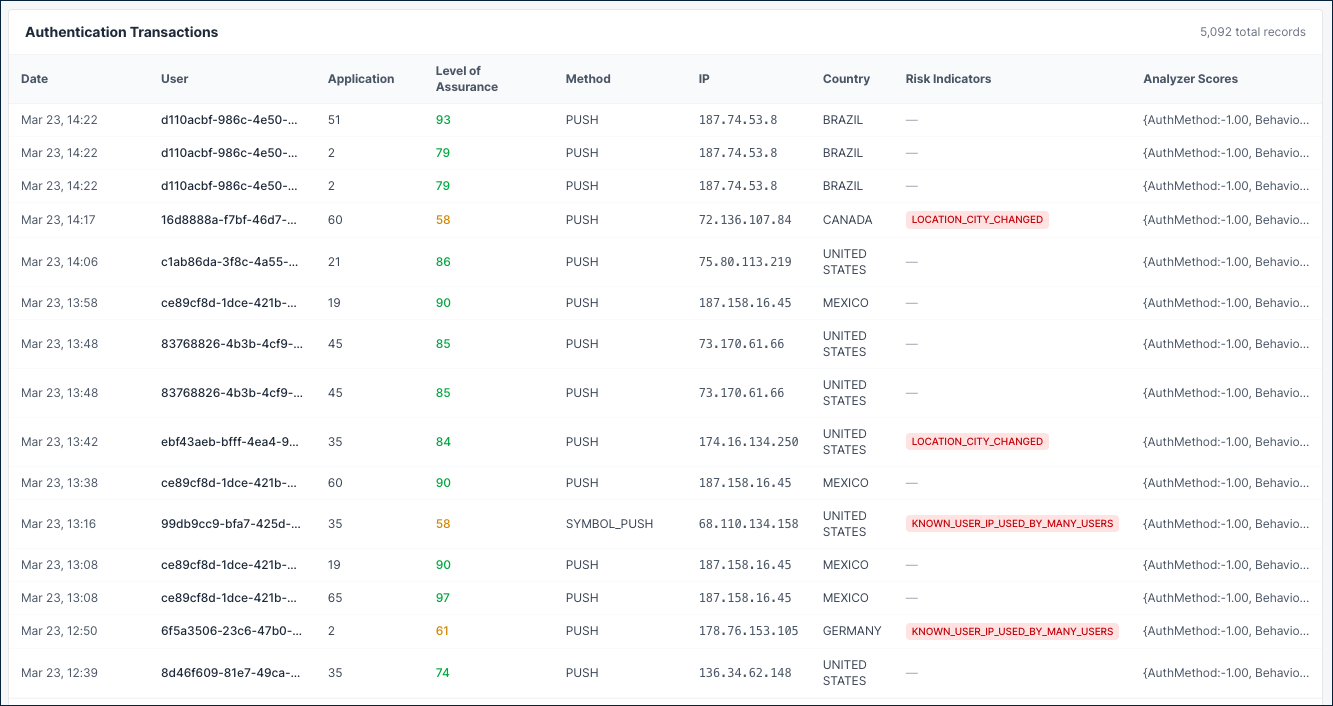
Authentication transactions
A paginated table showing individual authentication events with full details.
| Column | Description |
|---|---|
| Date | When the authentication event occurred. |
| User | The user ID associated with the event. |
| Application | The application identifier. |
| Level of Assurance | The overall LoA score for the event. |
| Method | The authentication method used (PUSH, SYMBOL_PUSH, TOTP, and others). |
| IP | The source IP address of the authentication attempt. |
| Country | Geographic location of the login attempt. |
| Risk Indicators | Specific risk signals detected, such as KNOWN_USER_IP_USED_BY_MANY_USERS, LOCATION_CITY_CHANGED, or LOCATION_COUNTRY_CHANGED. Displays a dash when no risk indicators are present. |
| Analyzer Scores | Individual scores from each risk analyzer: AuthMethod, BehaviourSignal, MlKtg, MlKtu, DBFP, IP, and Location. Scores of -1.00 indicate the analyzer was not computed for that event. |
Why it matters: Provides full visibility into individual authentication events for investigating specific incidents or auditing authentication activity.
When to check: When investigating specific users, IPs, or risk events flagged in other dashboard sections.
Risk Assessment tab
Risk assessment overview
Four summary cards show the current threat landscape.
| Card | Description |
|---|---|
| Risky Users | Number of users with more than 10 low-LoA authentication events during the selected time range. |
| Burst Login Users | Number of users with more than 10 logins within a 5-minute window, indicating potential brute-force behavior. |
| Credential Stuffing Pairs | Number of user and IP combinations with more than 8 logins in a 5-minute window, indicating credential stuffing patterns. |
| New Devices | Total number of new device detections during the selected time range. |
When to check: Daily as part of security operations to get a quick threat summary.
Risky auth indicators
A horizontal bar chart showing which risk indicators are triggered most often.
What it shows: Breakdown of risky authentications by risk indicators triggered during the selected time range, such as:
KNOWN_USER_IP_BUT_USED_BY_OTHERS- A known user's IP is being used by other accounts.KNOWN_USER_IP_USED_BY_MANY_USERS- The IP address is shared across many user accounts.LOCATION_STATE_CHANGED- The user's state or region changed between authentication events.LOCATION_CITY_CHANGED- The user's city changed between authentication events.LOCATION_COUNTRY_CHANGED- The user's country changed between authentication events.LOCATION_CHANGE_NOT_SIGNIFICANT- A location change was detected but was not significant enough to flag as risky.
Why it matters: Shows the most common threat types affecting your environment. A high count of shared-IP indicators may suggest NAT or proxy usage, while frequent location changes may indicate account compromise or travel.
When to check: When tuning risk policies, or when investigating the types of threats targeting your applications.
Top 10 IPs with low LoA auths
Top 10 IP addresses with the lowest Level of Assurance during the selected time range.
Why it matters: Risky IPs may indicate botnets, proxy networks, or compromised infrastructure being used to attack your authentication system.
What to do: Cross-reference risky IPs with known threat intelligence. Consider adding high-risk IPs to block lists or adjusting geo-based policies.
Top 10 risky users
Top 10 users with the most low-LoA authentication events (average LoA below 20%, more than 10 low-LoA events) during the selected time range.
Why it matters: These users may be compromised, under attack, or authenticating from high-risk contexts. They should be investigated first during security reviews.
What to do: Investigate the flagged accounts. Consider requiring step-up authentication, forcing password resets, or reviewing their authentication transactions on the Overview tab.
Anomalous login patterns
Six tables detect unusual login behavior that may indicate attacks or automation.
| Table | Description |
|---|---|
| Frequent Logins by IP | IP addresses with the highest number of login attempts during the selected time range. |
| Frequent Logins by User | Users with the most low-LoA authentication events (more than 10 low-LoA events) during the selected time range. |
| Burst Logins by User (5m window) | Users with the highest number of login attempts within a 5-minute window, indicating potential brute-force or automated login behavior. |
| Multi-IP Users | Users logging in from the most distinct IP addresses, which may indicate account sharing or compromised credentials. |
| User + IP Burst (Credential Stuffing) | User and IP combinations with the highest login bursts in a 5-minute window, indicating potential credential stuffing patterns. |
| New Device Detection Over Time | Trend of first-time device logins over time. Spikes may indicate account takeover attempts or credential stuffing campaigns. |
Why it matters: Abnormal login volumes and burst patterns are strong indicators of automated attacks, credential stuffing, or account abuse.
When to check: When investigating suspicious activity alerts, or as part of daily security operations.
What to do: Investigate flagged accounts and IPs. Burst login patterns from a single user+IP combination are a strong signal for credential stuffing. Consider implementing rate limiting or blocking the source.
How to use this dashboard
- In SecureAuth Connect, from the left menu, go to Analytics > Remote Risk Dashboard.
- Select a time range at the top of the page: 60 days, 30 days, 7 days, 48 hours, 24 hours, 1 hour, or a custom range.
- Start on the Overview tab to review summary cards, risk quality indicators, and geographic activity.
- Check the Anomaly Detection charts for trends in analyzer scores and LoA distribution.
- Use the Authentication Transactions table to drill down into individual events.
- Switch to the Risk Assessment tab to investigate risky users, IPs, and credential stuffing patterns.
When to escalate
Contact your security team if you see:
- Average LoA dropping significantly below 75%
- Spike in cutoff events or low-LoA authentications
- Multiple users or IPs appearing in the risky users and risky IPs tables
- Burst login patterns indicating credential stuffing
- Growing data quality gaps (missing device fingerprints or incomplete auths)
- New risk indicators appearing that weren't present before