Overview
See gateway traffic, inventory, LLM spend and open anomalies for a time range, and jump to the screen behind each.
In the console: Overview › Overview
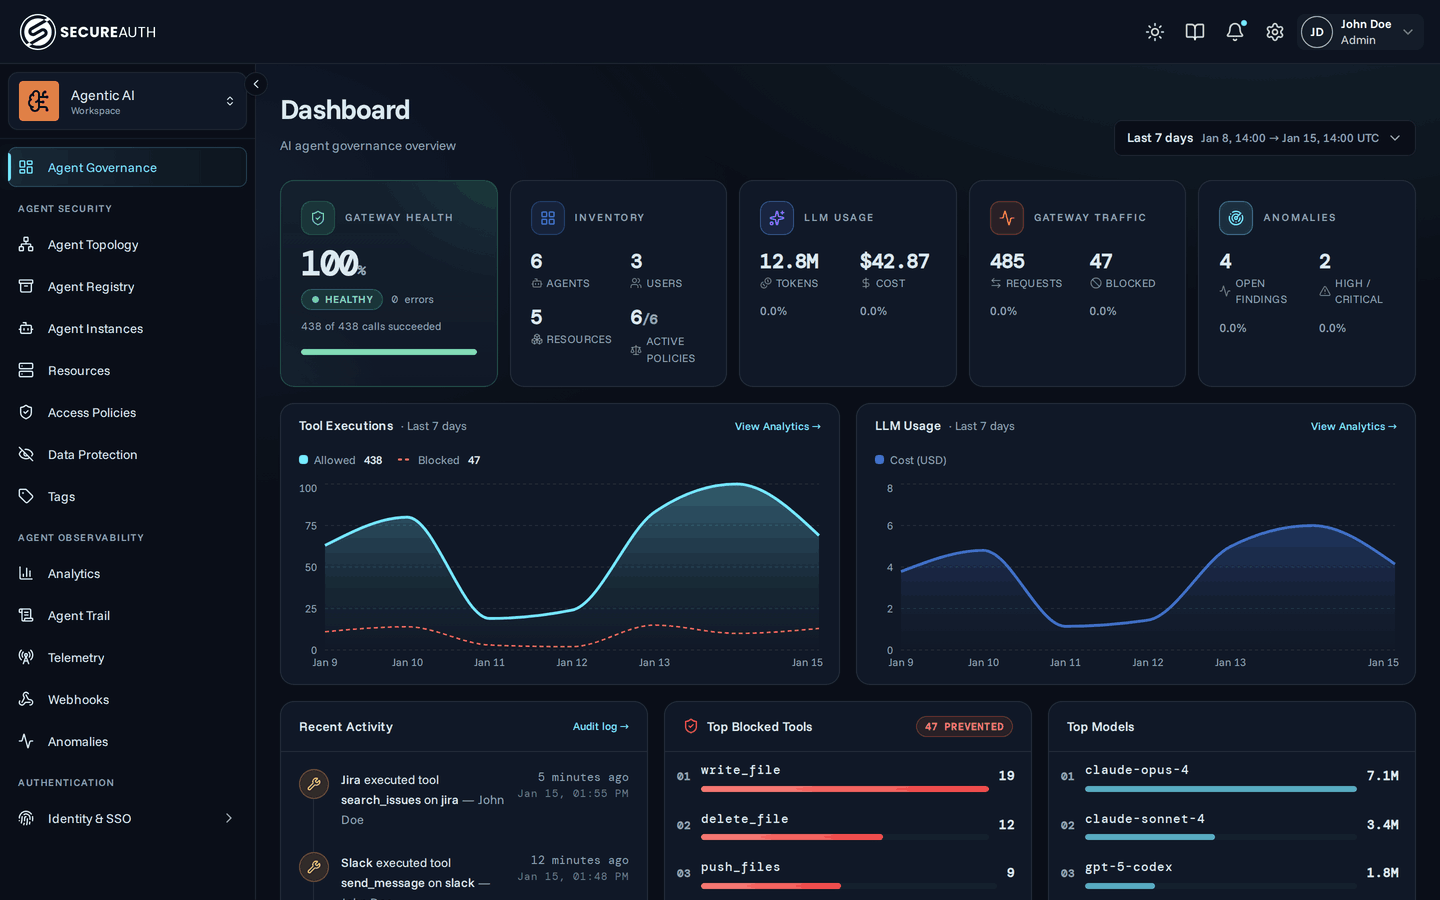
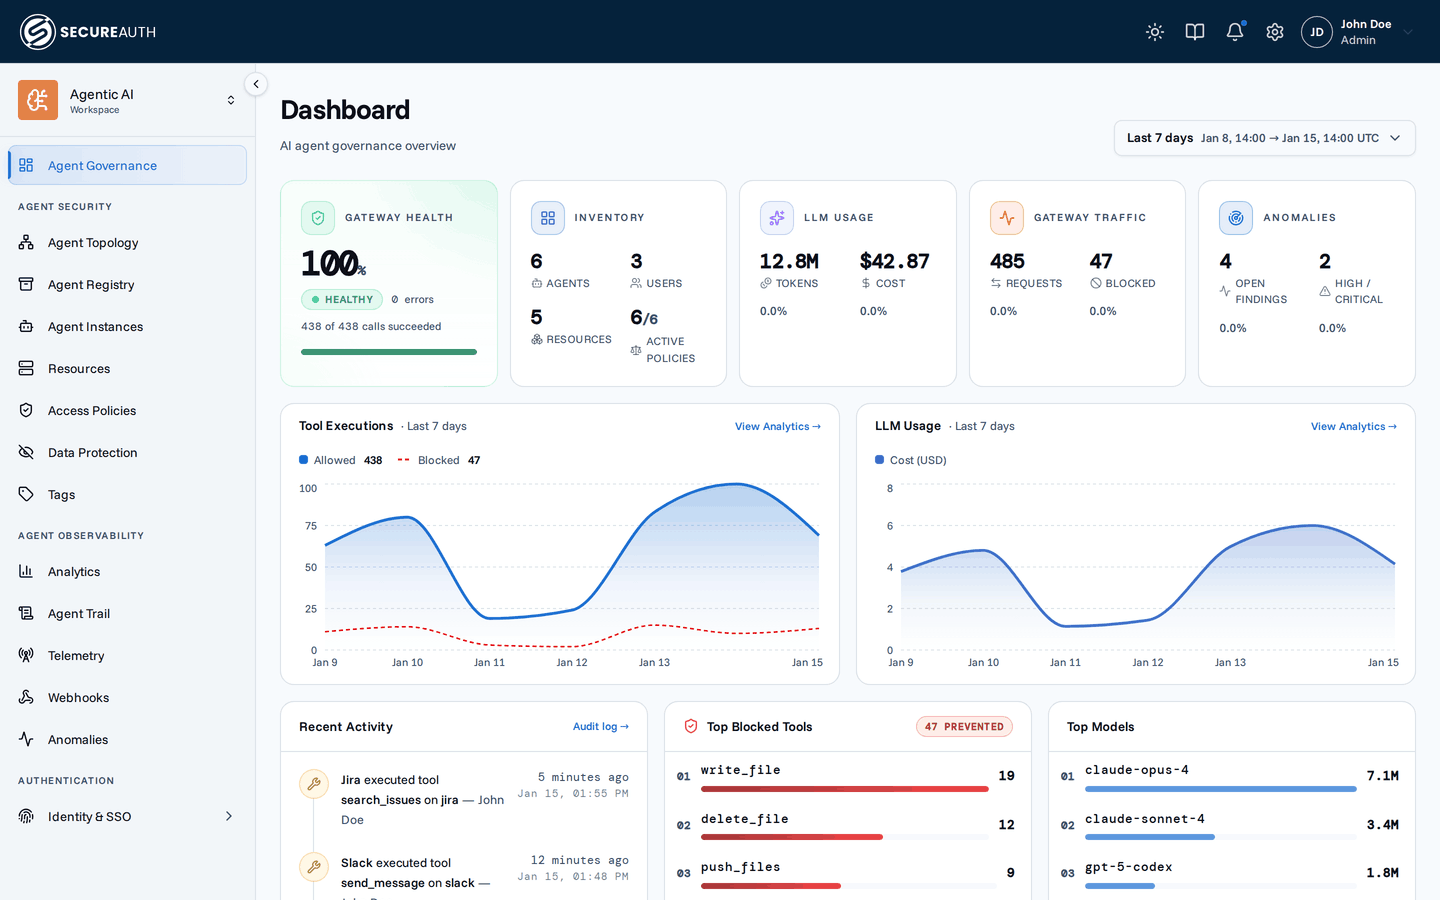
Overview is the console's landing page. It summarizes gateway traffic, inventory, LLM usage and anomalies for the time range you pick. Use it to spot a change, then select a number or card link to open the screen with the detail.
Time range
The date range picker in the page header sets the range for every card and chart. Choose a preset, such as Last 24h, Last 7 days or This month, or set a Custom range. Last 90 days isn't offered on this screen. Most numbers show a change against the previous period of the same length.
Summary cards
| Card | Shows |
|---|---|
| Gateway | Requests that reached the gateway, Blocked calls, and the success rate with the number of errors. A status pill reads Reliability: Healthy, Reliability: Degraded, Reliability: Critical or No traffic. |
| Inventory | Agents, Users (active in the range), Resources, and Active Policies as active out of total. |
| LLM Usage | Spend when seat pricing is set, otherwise an API-Equivalent estimate, and Tokens. With seat pricing, Seat Cost and API Spend split the spend. |
| Anomalies | Open Anomalies and High / Critical anomalies. |
The success rate counts executed calls against executed calls plus errors. Blocked calls don't lower it, because a block is a policy decision, not a failure. The pill reads Healthy at 90% or more, Degraded from 75%, and Critical below that.
Each number links to its screen, such as Agents & NHIs, Human Identities, Tools & Services, Agent Access, Cost & Adoption, Enforcement Traffic, or Anomalies and Findings. A number links only when you have the permission for the screen it opens.
Charts and lists
- Tool Executions – tool calls over the range, with Allowed and, when any exist, Blocked calls. View Analytics → opens Enforcement Traffic.
- LLM Usage – tokens over the range. View Analytics → opens the LLM tab of Enforcement Traffic. With no LLM usage yet, a setup card takes its place and links to telemetry setup or the Quickstart.
- Recent Activity – the latest gateway events. Audit log → opens Agent Trail.
- Top Blocked Tools – the tools blocked most often in the range.
- Top Models – the models that used the most tokens. It appears only when there is LLM usage.
Actions
This screen is read-only. Change the time range, or select a number or link to open the screen behind it.
Permissions
The Overview menu item needs both view_tool_analytics and view_agent_analytics, for all users.
Without view_tool_analytics, the landing page shows the user portal dashboard instead.
Parts of the page need more:
- LLM Usage card and charts –
view_llm_analytics. - Anomalies card –
view_anomaly_detection. - Active Policies count –
view_policies.
Related
- Dashboard – what each number means and how to read the trends