Enforcement Traffic
Chart tool calls, token usage and policy blocks over time, and export each view as CSV.
In the console: Activity › Enforcement Traffic
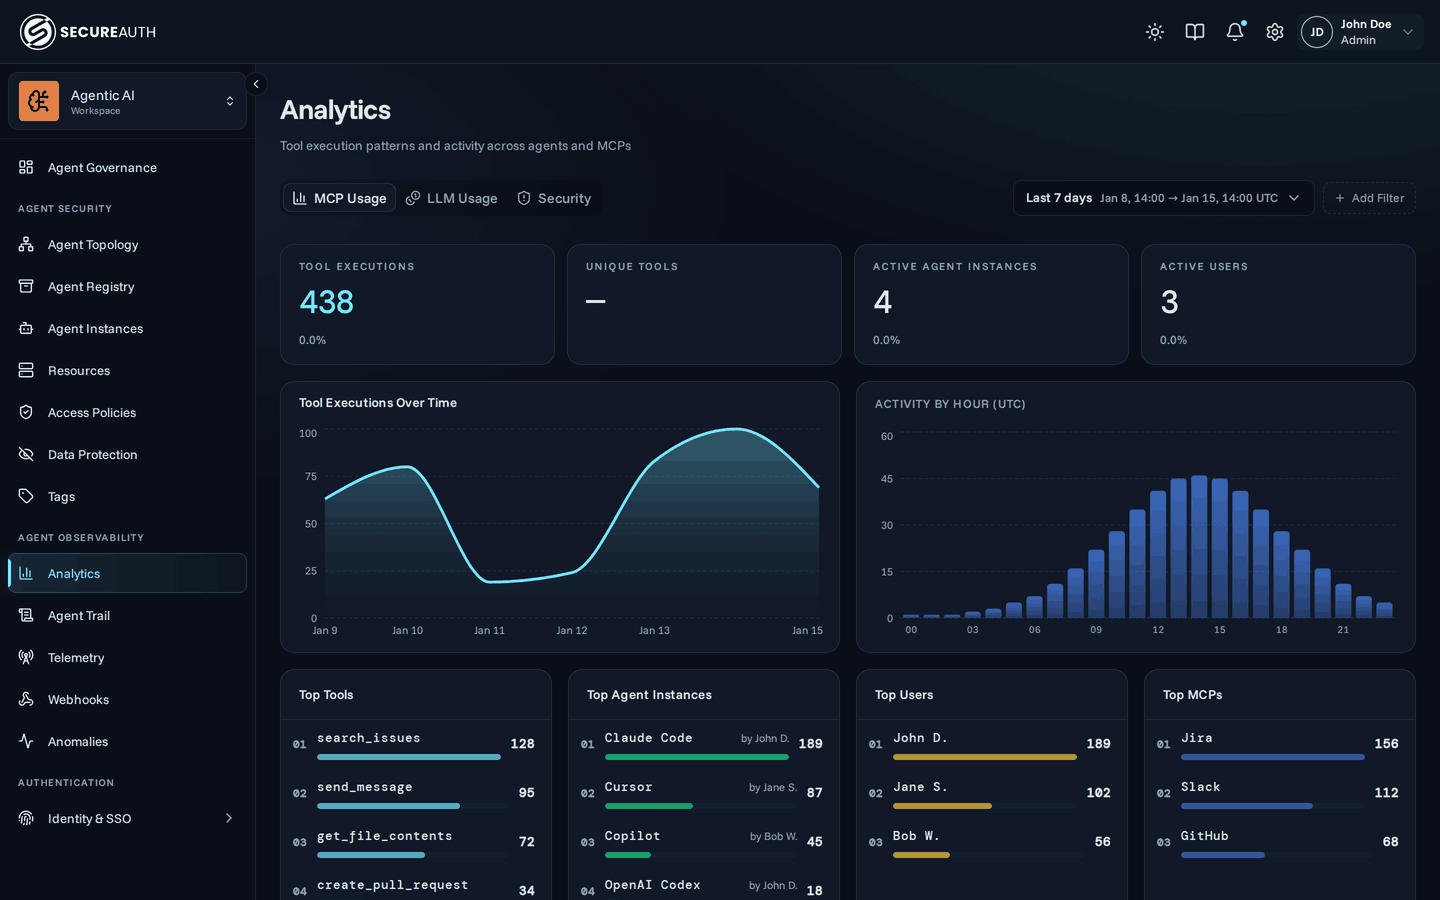
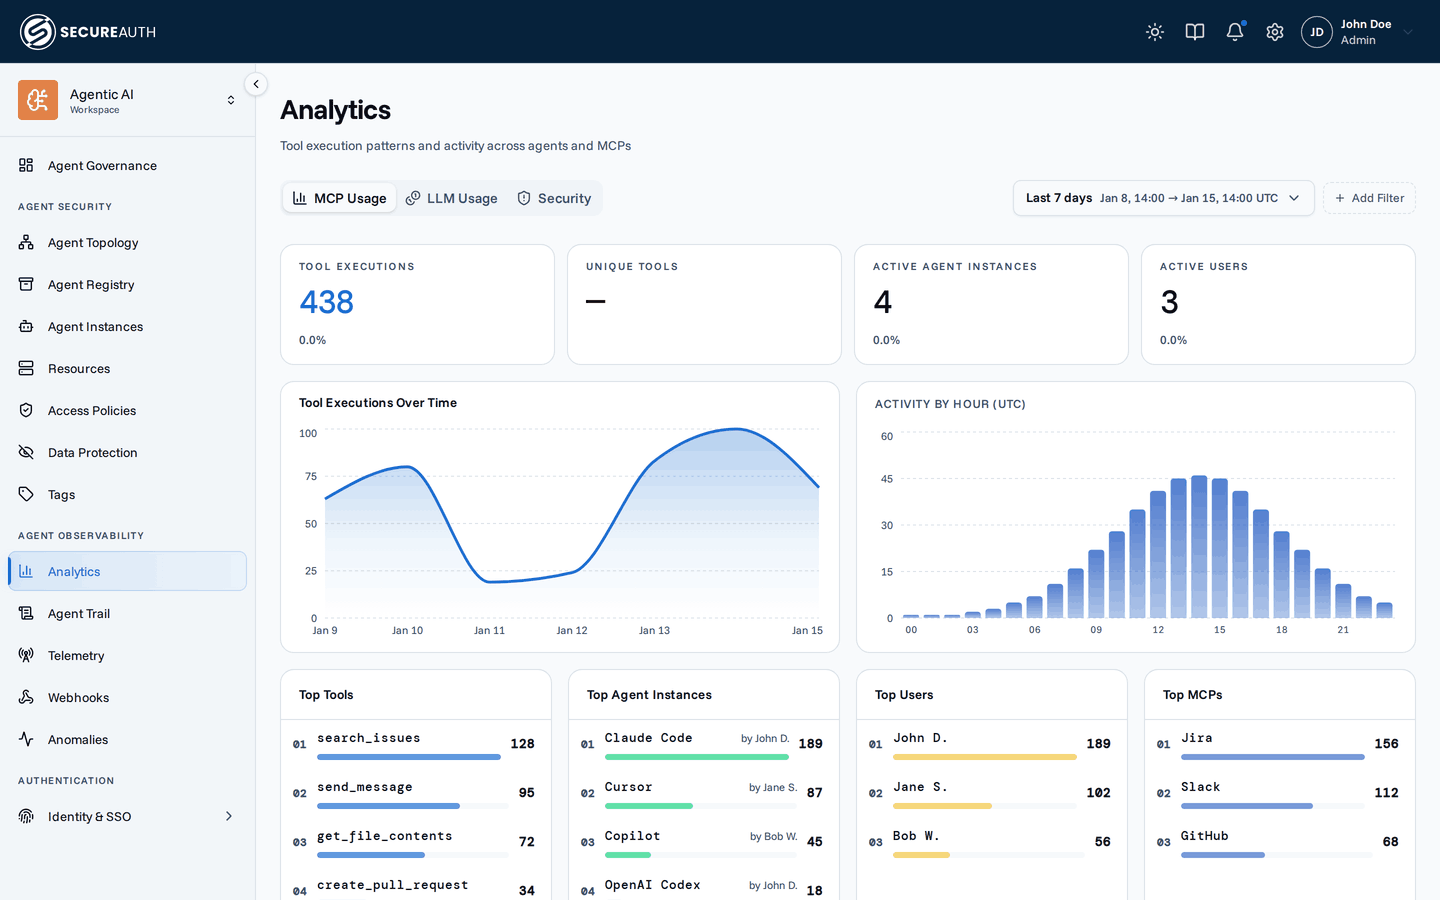
This screen charts what passed through the gateway: tool calls, LLM token usage, and the calls a policy blocked. Use it to spot a trend or a spike, then open the Agent Trail for the individual events.
Filters
A date range picker and a filter bar sit above the tabs and apply to the open tab. The date range offers presets from Last 1h to This year, or a custom range.
On MCP Usage and Security, the filter bar offers Agent Instance, Agent, MCP, User, Group, Agent tag and Resource tag. On LLM Usage, it offers Telemetry provider, Model, Auth mode, User, Group and Agent. Agent Instance and Model provider join the LLM Usage filters when the AI gateway is turned on for your organization.
Stat cards compare each total with the previous period of the same length.
MCP Usage
| Panel | Shows |
|---|---|
| Tool Executions | Tool calls in the range |
| Unique Tools | Distinct tools called |
| Active Agent Instances | Agent instances that made a call |
| Active Users | Users whose agents made a call |
| Tool Executions Over Time | Tool calls across the range |
| Activity by Hour (UTC) | Tool calls by hour of day |
| Top Tools | The most-called tools, with their MCP server |
| Top Agent Instances | The busiest agent instances, with the user who runs each |
| Top Users | The users with the most calls; a name opens their profile |
| Top MCPs | The most-called MCP servers |
LLM Usage
This tab shows token usage that coding agents report through telemetry. With no usage yet, it shows No LLM usage yet and a Go to Telemetry link to Discovery Sources.
| Panel | Shows |
|---|---|
| Overview | Total Tokens, sessions and models, with Tokens / session, Duration / session and Requests / session |
| Tokens Over Time | Tokens across the range, with the API key share and the Previous period |
| Token breakdown | Tokens by type |
| Top Users by Tokens | The users with the most tokens; a name opens their profile |
| Top Models by Tokens | The models with the most tokens |
| Sessions | One row per agent session, sorted by Recent or Tokens |
The Sessions table has these columns:
| Column | Shows |
|---|---|
| User | Who ran the session |
| Agent | The coding agent |
| Model(s) | The models the session used |
| Tokens | Tokens across the session |
| Requests | Model requests in the session |
| Duration | How long the session ran |
| Last activity | When the session last sent usage |
Selecting a session opens Session timeline, with Token mix, Models, Session details and a Requests table of each model call (Time, Model, Tokens, Input, Output, Cache).
Security
| Panel | Shows |
|---|---|
| Blocked Calls | Tool calls a policy blocked |
| Unique Blocked Tools | Distinct tools that were blocked |
| Affected Agent Instances | Agent instances with a blocked call |
| Affected Users | Users with a blocked call |
| Blocked Tool Calls Over Time | Blocked calls across the range |
| Top Blocked Tools | The most-blocked tools |
| Top Blocked Agent Instances | The agent instances blocked most, with their user |
| Top Blocked Users | The users blocked most |
| Top Blocked MCPs | The MCP servers blocked most |
| Top Blocking Policies | The policies that blocked the most calls |
Actions
- Download – exports the open tab as a ZIP of CSV files, with your filters and date range applied.
The ZIP includes a
manifest.txtthat records the tab, range and filters.
Permissions
The screen appears with view_tool_analytics.
- MCP Usage and Security – need
view_tool_analytics. - LLM Usage – needs
view_llm_analyticsfor the whole organization; without it the tab is hidden. - Download – needs the permission of the open tab.
- Model provider filter – needs
view_inferenceand the AI gateway turned on. - Opening a user from a Top Users list – needs
view_users.
Related
- MCP usage analytics, MCP security analytics, and LLM analytics – what each tab's charts measure and how to read a spike
- Agent Trail – the individual events behind a chart
- Discovery Sources – send agent telemetry so LLM Usage has data