Cost & Adoption
See what your organization pays for LLM usage, its value at API list price, and which teams use their seats.
In the console: Activity › Cost & Adoption
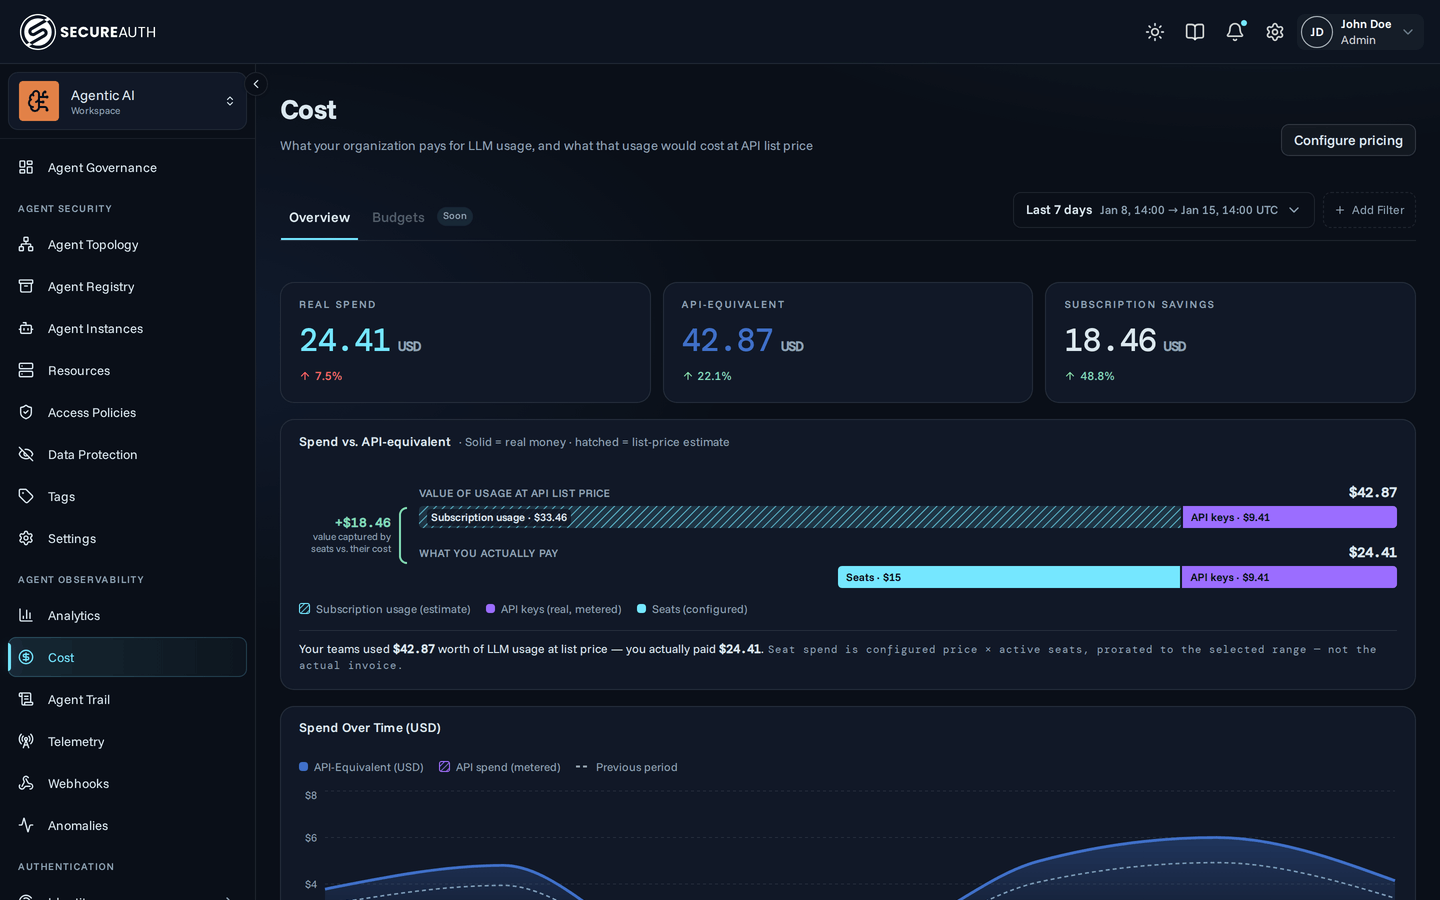
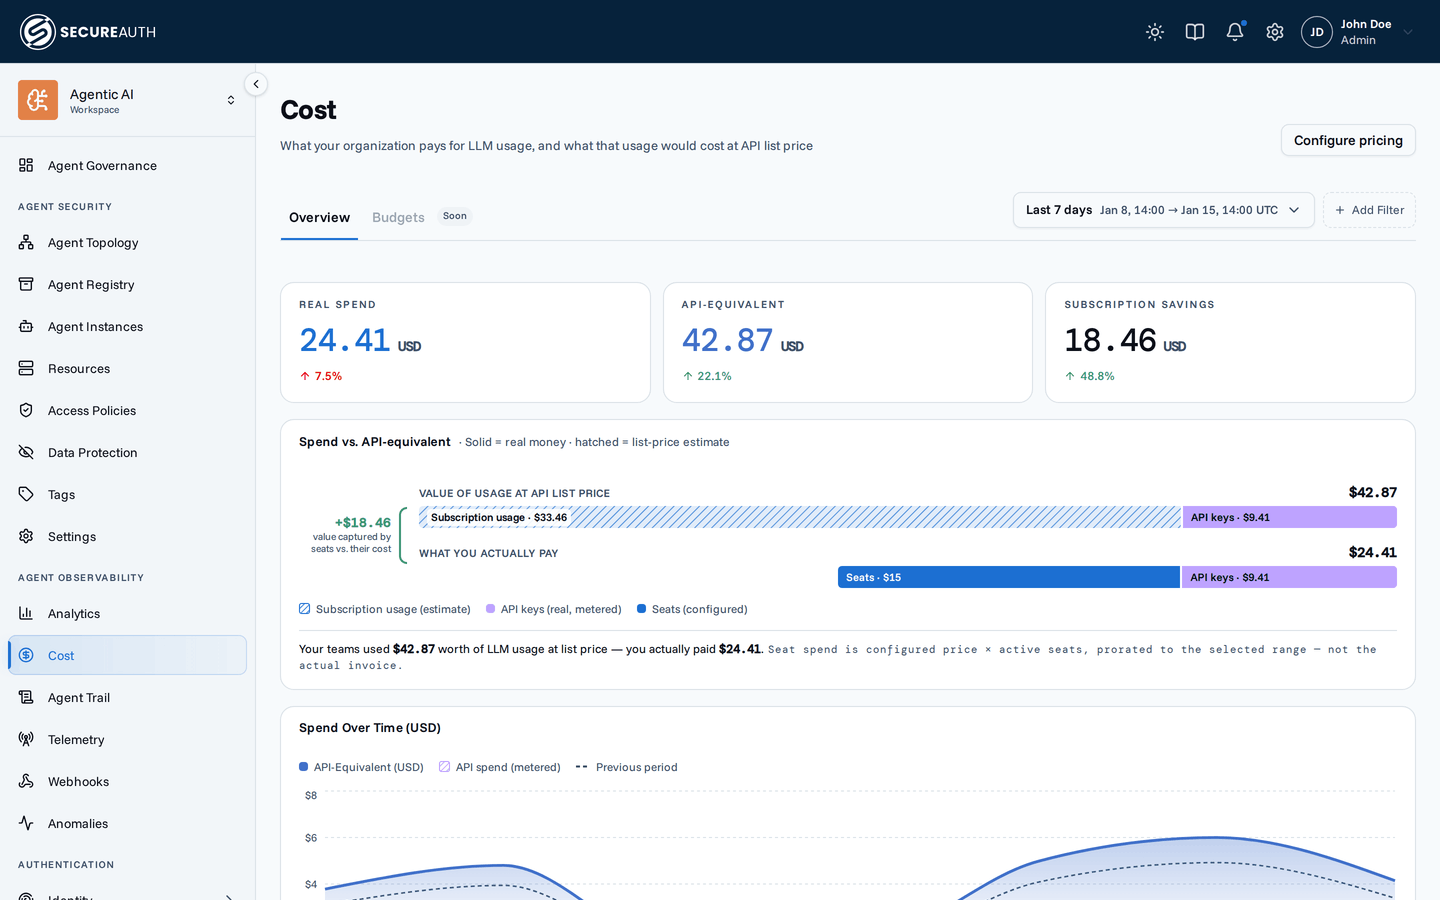
This screen shows what your organization pays for LLM usage, what that usage would cost at API list price, and who is using it. Use it to compare subscription seats with metered API spend and to find teams that leave their seats idle.
Filters
A date range picker and a filter bar sit above the panels and apply to the whole page. The date range offers presets from Last 1h to This year, or a custom range.
The filter bar offers Telemetry provider, Model, Auth mode, User, Group and Agent. Agent Instance and Model provider appear when the AI gateway is turned on for your organization.
The totals and Spend vs. API-equivalent ignore the Model, Agent, Agent Instance and Model provider filters, because those can't scope a seat. The page shows a note when one of them is set. The team panels stay organization-wide and ignore the User filter.
Overview
The Overview tab holds every panel. The Budgets tab is marked Soon and can't be opened.
| Panel | Shows |
|---|---|
| Real Spend | Metered API-key spend plus seat cost; compared with the previous period once seat pricing is set |
| API-Equivalent | The value of all usage at API list price |
| Subscription Savings | The value seats captured beyond their cost |
| Spend vs. API-equivalent | Two bars: Value of usage at API list price and What you actually pay |
| Spend Over Time (USD) | Spend across the selected range |
| Cost by team | Active and idle seats, then a table of teams, a scatter of adoption against cost, and seat usage per person |
| Model mix by team | API-equivalent spend per model family for each team |
| Token economics | Cache-hit rate and Blended cost, with each token type's share of cost |
| Top Users by API-Equivalent (USD) | The users with the highest API-equivalent spend; a name opens that user's profile |
| Top Models by API-Equivalent (USD) | The models with the highest API-equivalent spend |
Without seat pricing, Real Spend counts metered API-key spend only and Subscription Savings shows no value.
The Cost by team table has these columns:
| Column | Shows |
|---|---|
| Team | The group |
| Seats | Seats in the team |
| Active | Active users in the team |
| Adoption | Active users as a share of seats |
| Real $ | The team's real spend; API spend only without seat pricing |
| $ / active user | Real spend divided by active users |
Below the table, the panel names the teams under 50% adoption. It counts CLI telemetry only, so confirm a web-first team's usage before you reclaim its seats.
With no spend in the range, the page shows No LLM usage yet and a Go to Telemetry link to Discovery Sources.
Actions
- Configure pricing – opens the subscription pricing settings, where you set seat prices. The Configure seat pricing links in the panels open the same settings.
Permissions
The screen appears with view_llm_analytics for the whole organization.
A grant scoped to your own data shows Cost data unavailable instead of figures.
- Configure pricing – needs
manage_seat_pricing. - Model provider filter – needs
view_inferenceand the AI gateway turned on. - Agent Instance filter – needs the AI gateway turned on.
- Opening a user from Top Users by API-Equivalent (USD) – needs
view_users.
Related
- Cost and adoption – how each panel computes spend and how filters scope it
- LLM usage and cost – send agent telemetry so this screen has data
- Discovery Sources – create the ingest keys agents send telemetry with