Dashboard
The SessionGuardian Dashboard provides near real-time insights into user activity and alerts. Use the dashboard to monitor user status, track security events, and generate reports. The dashboard includes the following key sections:
Summary graphs – View a high-level overview of user and alert statuses.
Event viewer – Access detailed event and alert data for each user profile.
Filters and search – Refine data by attributes like username, project, or security group.
Export – Generate and download CSV reports for users or alerts.
Dashboard Summary Graphs
User Summary
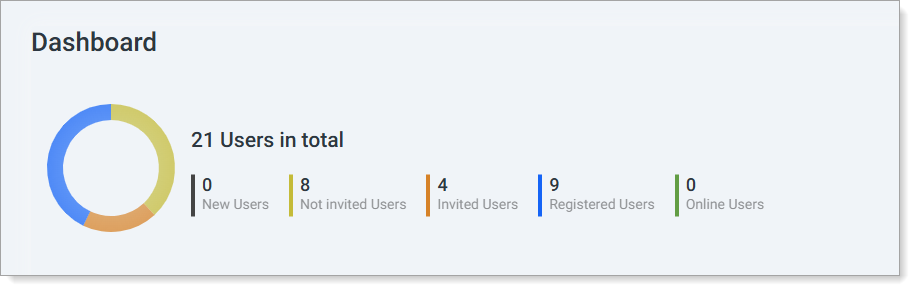 |
View the status of all user profiles:
User Total – Total number of user profiles in the platform.
Online Users – Number of registered users currently online.
Invited Users – Users who received invitations but haven’t registered yet.
Registered Users – Registered users who are offline.
Not Invited Users – Users with installed software but no invitation sent.
New Users – Profiles newly created in the Admin Console.
Alert/Event Summary
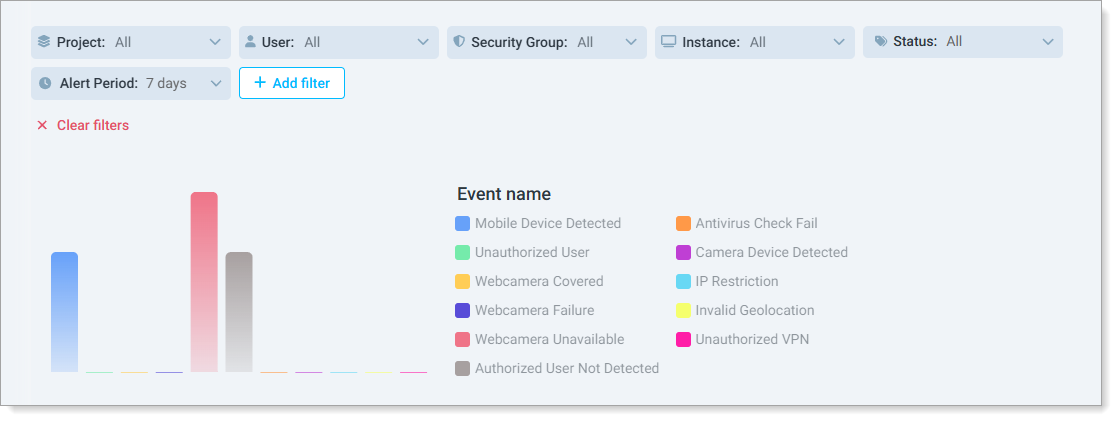 |
Track security events over a specific time period:
Mobile Device Detected – Count of mobile device detection events.
Unauthorized User – Events where an unauthorized user was detected.
Webcam Covered – Webcam issues like being covered.
Webcam Failure – Webcam issues like failures.
Webcam Unavailable – Webcam issues like being disconnected or unavailable.
IP Restrictions – Violations of IP restrictions.
Unauthorized VPN – Access attempts via unauthorized VPNs.
Invalid Geolocation – Users accessing from restricted geolocations.
Authorized User Not Detected – Authorized users not visible for extended periods.
Antivirus Check Failure – Failures during antivirus checks.
Camera Device Detected – Unauthorized camera detection events.
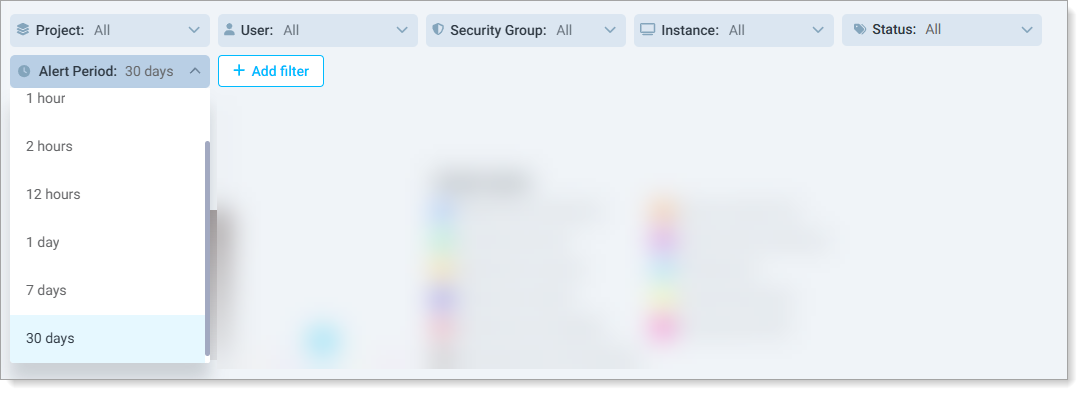
Note: Use the Alert Period list to adjust the time frame for the displayed data.
Event viewer
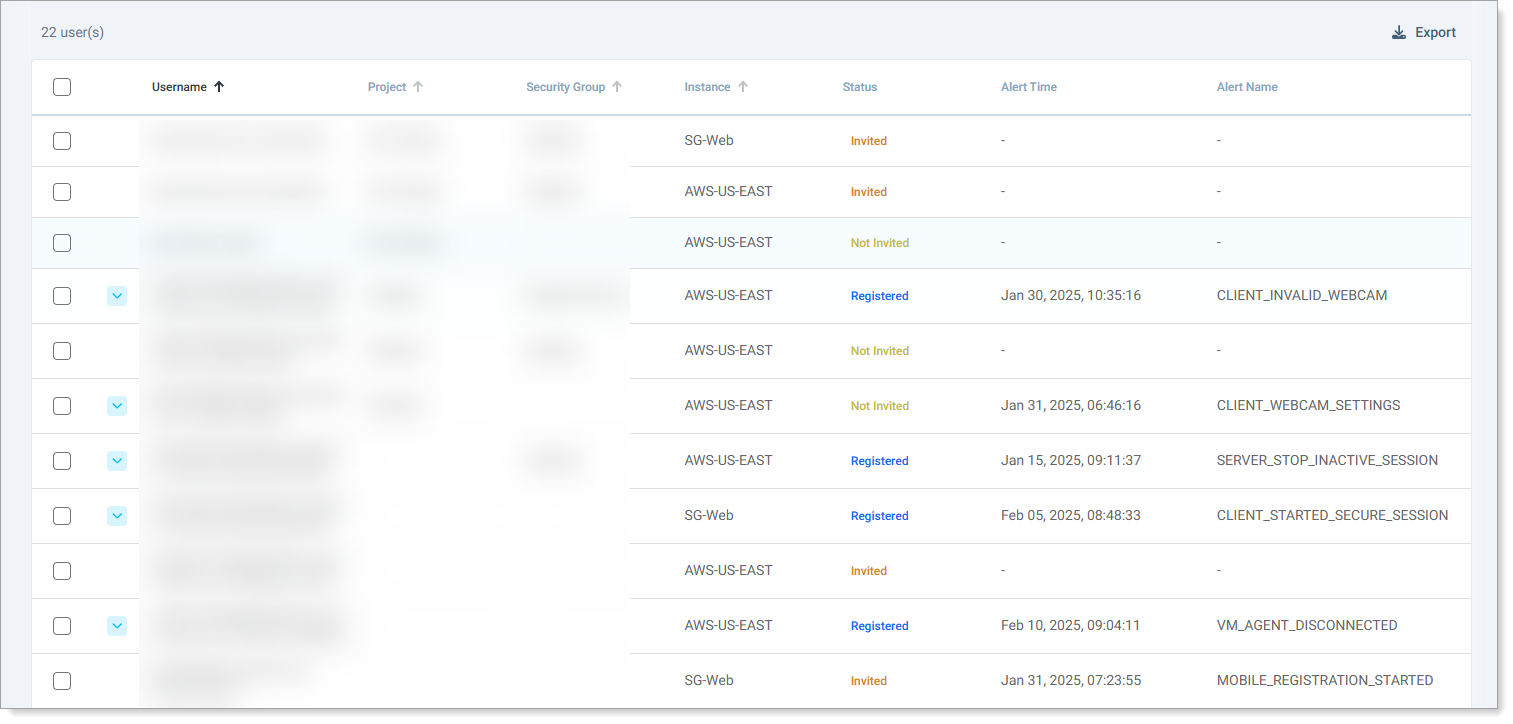 |
The Event Viewer displays detailed information for user profiles, including:
Username
Project
Security Group
Instance
Status
Alert Time and Alert Name
Count of events or alerts
You can sort the Event Viewer by username, project, security group, or instance.
Filters and search
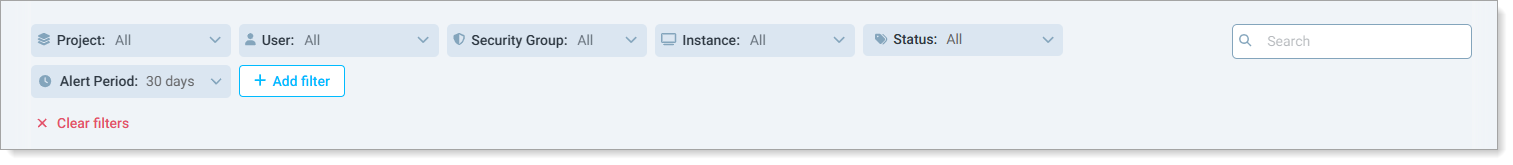 |
Use filters to refine the displayed data by:
Username
Project
Security Group
Instance
Status (select multiple values)
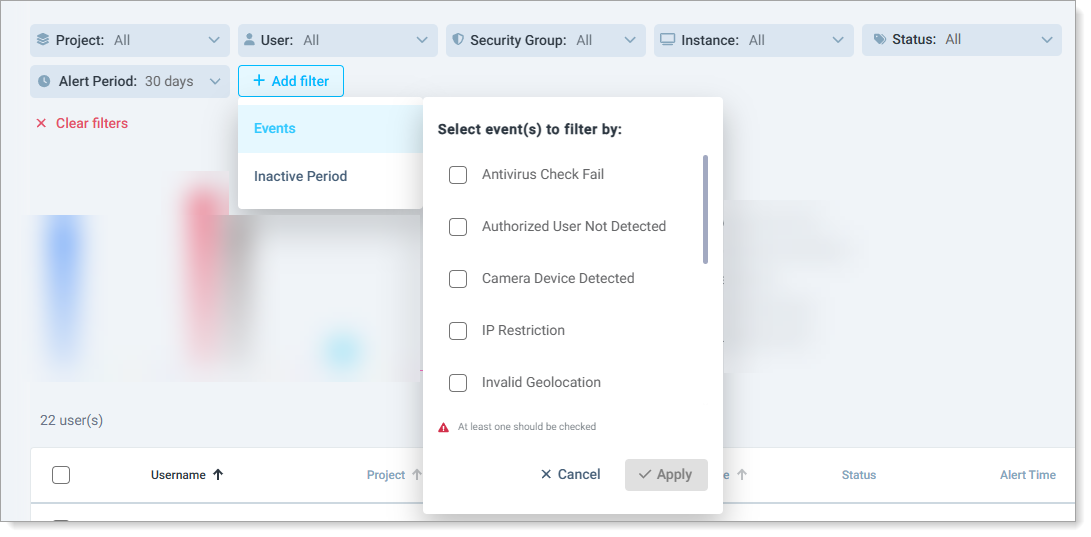
Event Type (via + Add Filter)
Inactive Period
Perform a free-text search on attributes like username, project, or security group. Clear search results by clicking the X in the search field.
Export data
Export dashboard data in CSV format to generate reports:
User report
Use the Alert Period list to select a time frame.
Ensure the target user is visible in the Event Viewer. Use filters to find the user if necessary.
Select the check box next to the user profile.
Click Export to generate the CSV report.
Result: The exported CSV contains detailed data for users based on the selected filters.
Alert report
Use the Alert Period list to select a time frame.
Use the + Add Filter option to select one or more alert types.
Apply additional filters if needed.
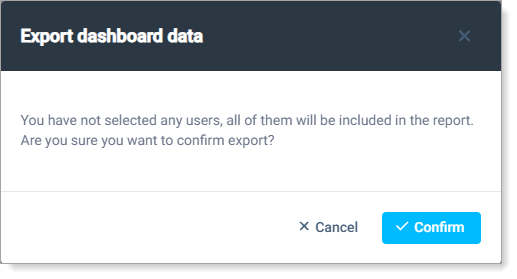
Click Export to generate the CSV report. If no users are selected, confirm the export when prompted.
Result: The exported CSV contains detailed data for alerts based on the selected filters.