Dashboard: Login Data overview
The Login Data tab provides a comprehensive view of authentication activity across your SecureAuth IdP environment. It covers login volume, success and failure trends, authentication method usage, operating system and application breakdowns, and Level of Assurance (LOA) scores.
Use this guide to understand what normal activity looks like and recognize patterns that warrant investigation.
Login Data subtabs
The Login Data tab is organized into the following subtabs:
Subtab | What it shows |
|---|---|
Company dashboard (At a glance) | High-level overview of all login data across time frames from the past 24 hours to the past year. |
Hourly report (past 24 hours) | Login data broken down by hour for the past 24 hours. |
Company logins | Login data by user ID. |
OS statistics | Login data by operating system, browser, and IP address. |
Application/Realm number | Login data by application or realm number. |
Authentication method | Login data by MFA method. |
Auth risk insights | Threat monitoring for brute force, password spray, MFA fatigue, and risky IP activity. See Dashboard: Authentication risk insights. |
LOA Score | Real-time risk scoring data based on user behavior and device trust. See SecureAuth Level of Assurance (LOA) Provider settings. |
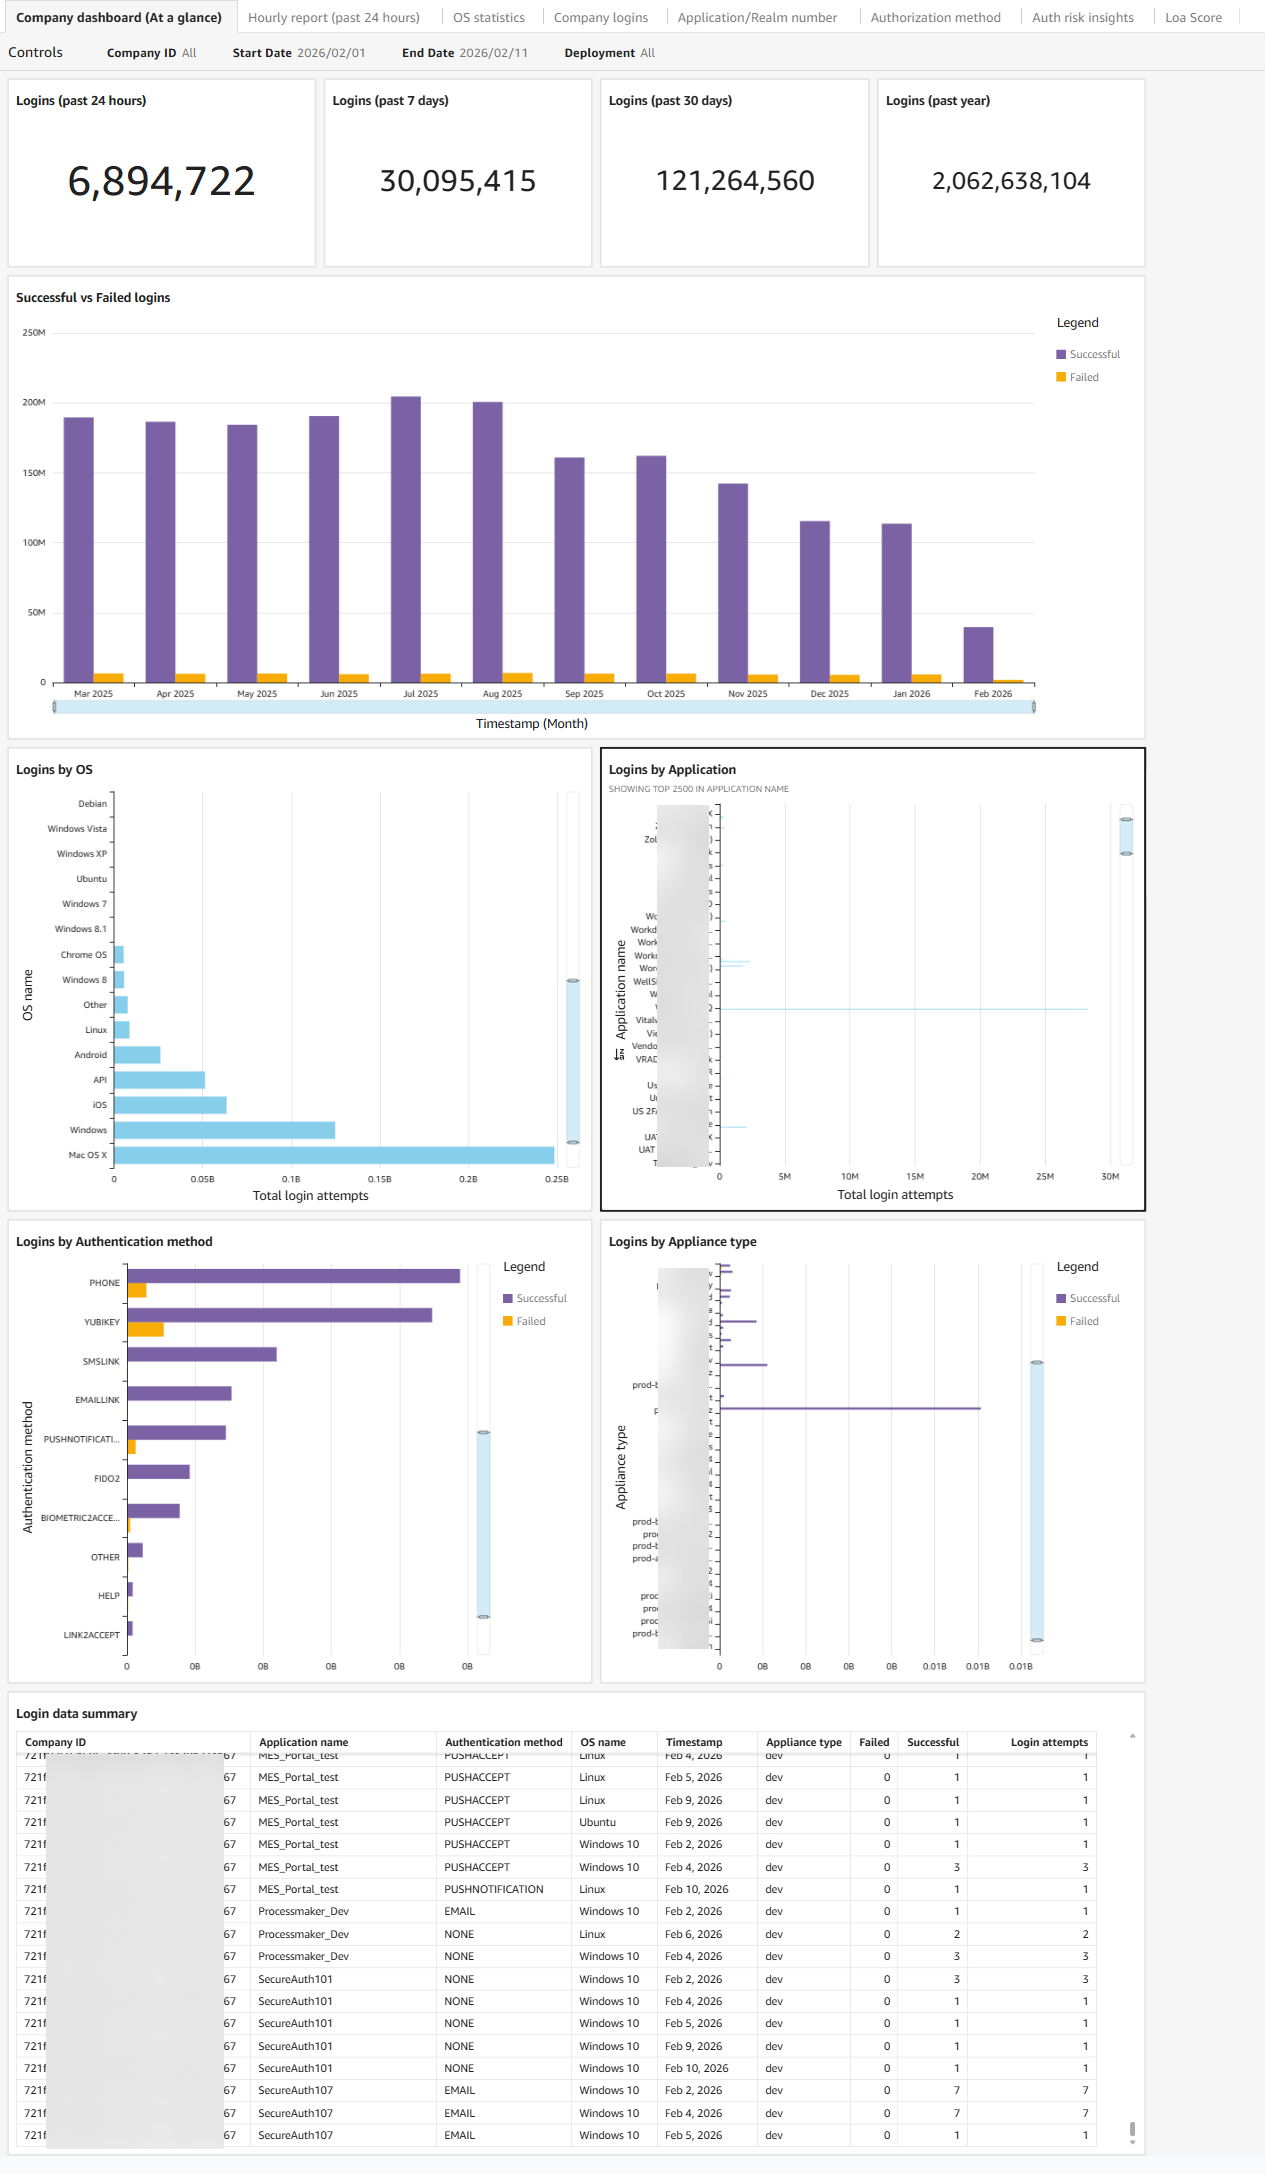
What the Company dashboard shows
The dashboard displays authentication activity across several areas: login volume over time, OS and device distribution, application usage, authentication method adoption, appliance performance, and a login data summary covering geographic distribution and Level of Assurance (LOA) scores.
Use the Controls section to filter by date range or company.
 |
What healthy activity looks like
Healthy authentication activity across the Company dashboard typically shows these patterns:
Stable success rates with proportional growth. Login volume grows gradually over time, and failed login rates remain low relative to successful logins. If your organization is adding users or rolling out new applications, you expect login counts to increase — but failure rates should not increase at the same pace.
Modern, managed OS distribution. The majority of logins come from current, managed operating systems. Seeing a consistent mix of Windows, macOS, iOS, and Android that aligns with your known device fleet is expected.
Login volume distributed across applications as expected. Applications show stable login counts that align with business usage patterns. High-traffic applications like your primary SSO target or HR platform will naturally show more activity than internal tools.
Strong authentication methods gaining adoption. Phishing-resistant methods such as FIDO2 and biometrics represent a growing share of logins. Passwordless and MFA adoption trend upward over time.
Appliance activity aligned with your deployment. Production appliances carry the expected share of traffic. Test or staging appliances show minimal activity.
Geographic distribution matches your user base. Logins originate from locations consistent with where your workforce operates. LOA scores remain stable over time.
Warning signs to watch for
The following patterns indicate something may be wrong and warrant further investigation.
Sudden spike in failed logins without matching user growth. A sharp increase in failed attempts that is not accompanied by a corresponding increase in successful logins often indicates a brute force or password spray attack in progress. Check the Auth risk insights tab to confirm.
High login activity from unknown, legacy, or outdated operating systems. Unexpected OS entries or a surge in logins from unsupported systems may indicate unmanaged devices accessing your environment, or an attempt to exploit OS-specific vulnerabilities.
Sharp increase in failed logins to a specific application. If one application shows a disproportionate spike in failures while others remain stable, it may be under targeted attack or experiencing a misconfiguration. Check the Application/Realm number tab.
Weak authentication methods dominating while strong options show low adoption. If password-only logins are increasing while MFA and passwordless adoption stagnates or declines, your authentication security is weakening. This is also a compliance and audit concern.
Unexpected appliance activity. A sudden spike of failed logins on a production appliance, especially one not associated with a known deployment or change, may indicate an attack or an outage affecting failover behavior.
Unusual geographic distribution or LOA score decline. Logins from unexpected regions, or a downward trend in average LOA scores, can indicate compromised accounts or policy changes that are weakening authentication confidence.
What to do next
When you see a warning sign, use the other dashboard tabs to investigate further before escalating.
If the Auth risk insights tab shows active threat data, see Dashboard: Authentication risk insights for details on each threat type and the features required to block them.
Warning sign | Where to investigate next |
|---|---|
Spike in failed logins | Auth risk insights tab, then Password Throttling configuration |
Unusual OS or device activity | OS statistics tab |
Application-specific failure spike | Application/Realm number tab |
Authentication method concerns | Authorization method tab |
User-level investigation needed | Company logins tab |
Hourly pattern or off-hours spike | Hourly report tab |
Company dashboard chart details
The following sections describe the charts displayed on the Company dashboard (At a glance) subtab.
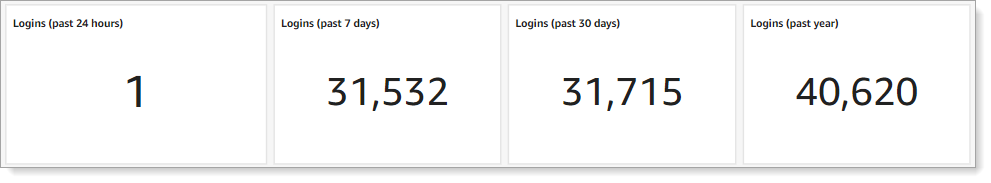
Number of logins to the Identity Platform
System overview of total logins, both successful and failed, processed by the Identity Platform. View the count for the past 24 hours, 7 days, 30 days, and year from today.
 |
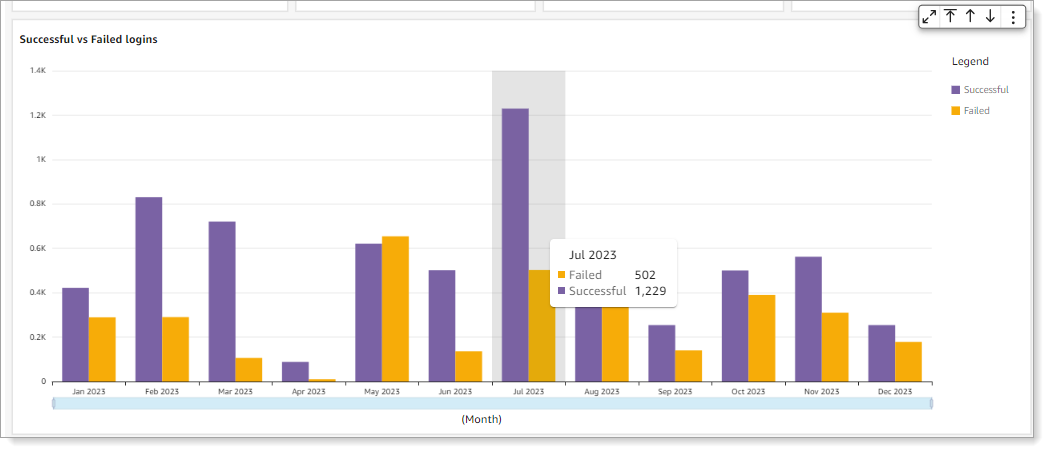
Successful vs. failed logins
Bar graph showing the number of successful and failed logins over time. Hover over a time period to see the breakdown. Click a bar to drill into the data.
 |
Logins by operating system
Shows the top five operating systems used for logins in the selected date range. The list includes API logins (displayed as "API") when the transaction is from an API workflow. "Other" indicates an unrecognizable operating system.
Note
To include API transactions in dashboard reporting, you need Identity Platform 20.06 or later and the /authenticated endpoint.
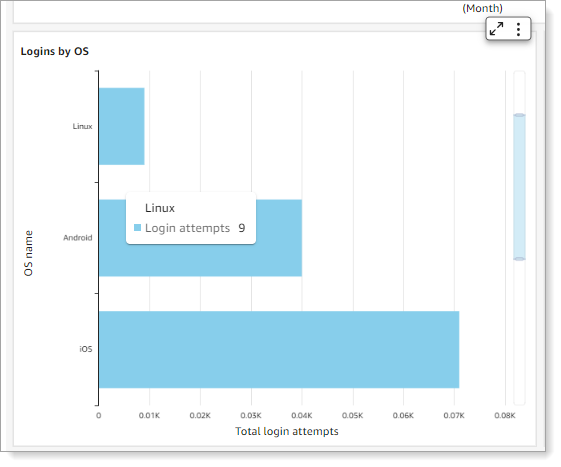 |
For more detailed OS data, select the OS statistics subtab.
Logins by application
Shows the number of logins for each application by realm name (such as Office 365, Salesforce, or Zoom). Hover over a bar to see the total login attempts for that realm.
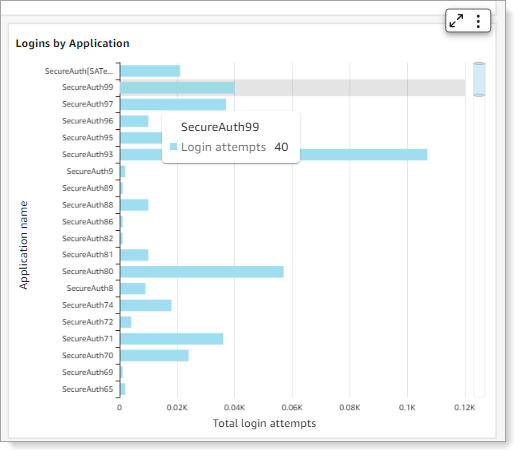 |
For more detailed application data, select the Application/Realm number subtab.
Logins by authentication method
Shows the MFA methods selected by users to authenticate. The dashboard only displays methods actively used by your users. Hover over a bar to see the total login attempts for that method.
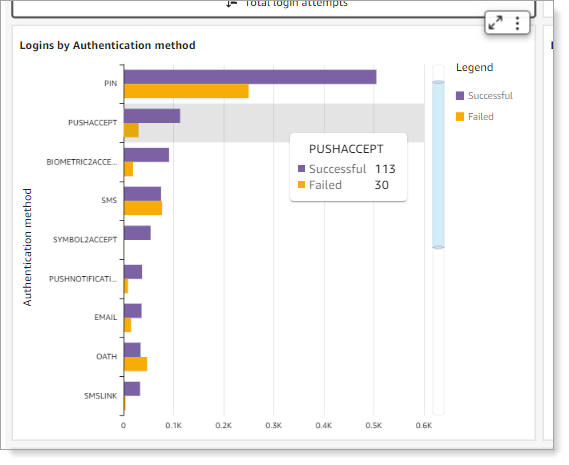 |
For more detailed MFA data, select the Authentication method subtab.
The following table lists all available MFA methods in the Identity Platform.
MFA method | Authentication type |
|---|---|
BIOMETRIC2ACCEPT | Biometric identification via Authenticate app |
One-time passcode (OTP) | |
EMAILLINK | Link-to-Accept |
FIDO2 | Registered FIDO2 authenticator |
HELP | Help Desk OTP |
KBA | Knowledge-based answer |
NONE | No MFA method used. This can occur when the policy workflow is configured without MFA, MFA is skipped due to a policy condition, or SSO is handled externally. |
OATH | Time-based one-time passcode (OATH-TOTP and OATH-HOTP) |
<OTHER> | Placeholder for custom integration |
<Empty or invalid value> | Empty or invalid MFA method value |
PHONE | Voice OTP |
PIN | Personal identification number |
PUSHACCEPT | Push-to-Accept |
PUSHNOTIFICATION | Push OTP |
SMS | OTP |
SMSLINK | Link-to-Accept |
SYMBOL2ACCEPT | Symbol-to-Accept |
VIPCREDENTIAL | Symantec VIP |
YUBIKEY | Non-FIDO2 YubiKey |